Solana moved closer to the $100 level as open interest approached a yearly high, showing stronger activity in leveraged positions. The next key test sits around the $110 to $138 zone, where the chart shows major resistance levels.
Solana Open Interest Nears Yearly High as $SOL Price Pushes Toward $100
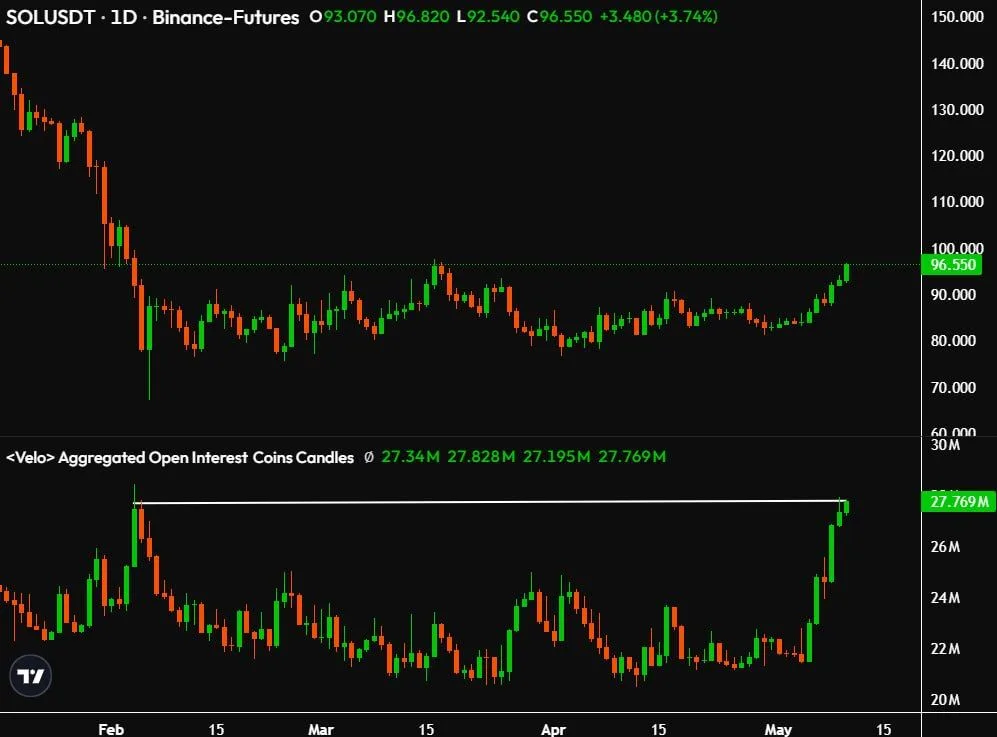
Solana traded near $96.55 on the daily Binance Futures chart, rising 3.74% as price moved toward the key $100 area. The chart shows $SOL recovering from its earlier decline and building higher momentum in early May.
Solana Open Interest Nears Yearly High. Source: Ted on X
Open interest also climbed sharply. The Velo aggregated open interest chart shows open interest near 27.77 million $SOL, close to the yearly high marked around February. Ted noted that $SOL open interest is approaching a yearly high and warned traders about heavy leverage.
This matters because rising open interest shows more leveraged positions entering the market. When price rises with open interest, it can support bullish momentum. However, it also raises liquidation risk if the move becomes crowded.
The $100 zone now acts as the main upside level for $SOL. If buyers push above it, the move could extend. However, if leveraged longs become too crowded, a pullback could trigger fast liquidations and increase short term volatility.
Solana Price Breaks Higher as $SOL Targets $110 to $138 Zone
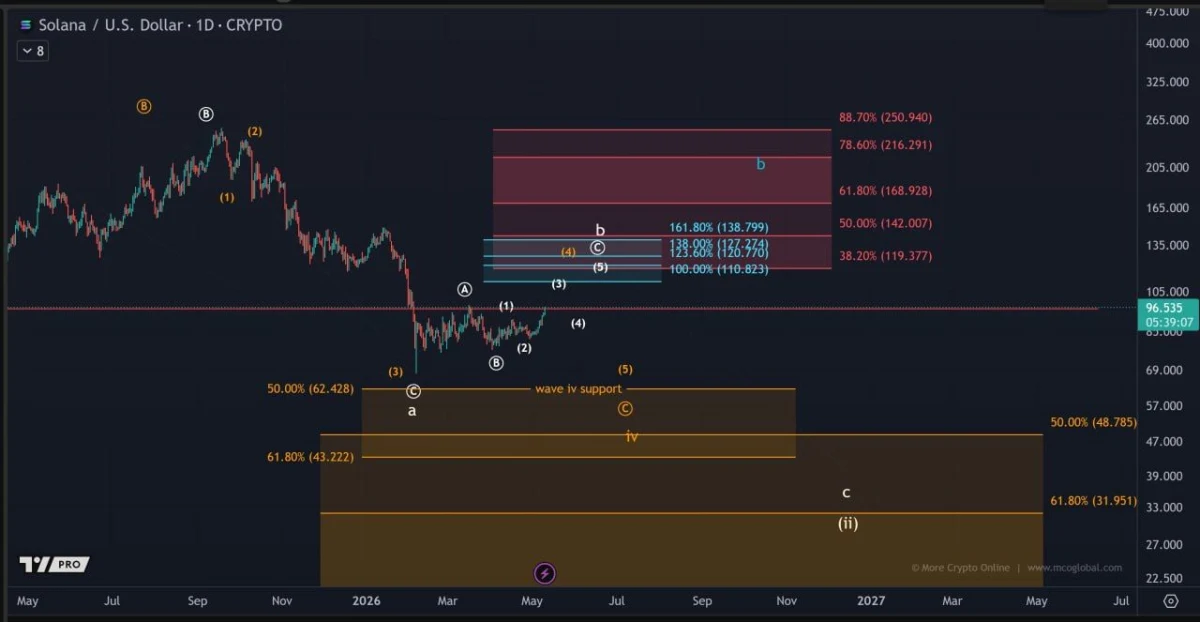
Solana traded near $96.53 on the daily chart after a sharp move higher from the spring base. The chart from More Crypto Online shows $SOL pushing above the recent consolidation zone, which keeps the short term bullish setup active.
The first major upside area sits between $110.82 and $138.80. This zone includes the 100%, 123.6%, 138%, and 161.8% extension levels marked on the chart. If $SOL keeps moving higher, this area becomes the main target zone for the current wave structure.
Solana Price Breaks Toward $110 Zone. Source: More Crypto Online on X
The wider Fibonacci retracement zone shows stronger resistance above that range. The chart marks $119.37, $142.00, $168.92, $216.29, and $250.94 as larger upside levels. These levels suggest $SOL could face heavier selling pressure as it moves deeper into the recovery range.
However, the bearish invalidation risk remains clear. The chart still marks a lower support area near $62.42 and $43.22 as wave iv support. A deeper bearish scenario also points to the $48.78 to $31.95 zone. That structure would matter only if $SOL fails to hold the current breakout and falls back under key support.
For now, the chart shows buyers in control. $SOL has moved away from the lower base, and the next test sits around the $110 to $138 resistance zone. If momentum holds, that area will decide whether the move continues or slows.