
Cardano has started to show signs of strength after spending weeks consolidating below a descending resistance trendline.
Analyst “iMoneyTeam” highlighted this after Cardano ($ADA) broke above the crucial neckline resistance on the 12-hour chart, following a series of decisive bullish candlesticks. The market watcher noted that the breakout has shifted short-term momentum, especially as the market continues to print higher lows across the structure.
Key Points
- Cardano has broken above the crucial neckline resistance on the 12-hour chart.
- Recent price momentum suggests buyers have begun to regain control of the market.
- $ADA has defended the broader support region around $0.24.
- The breakout above the descending trendline now places focus on several upside levels.
- A daily close below $0.236 would invalidate the bullish structure.
Cardano Breaks Bearish Bias
At the moment, $ADA trades near $0.261, up 8.4% in the past seven days. Recent price momentum suggests buyers have begun to regain control of the market. Technical analysis suggests so, too, as $ADA has defended the broader support region around $0.24, according to the accompanying chart.
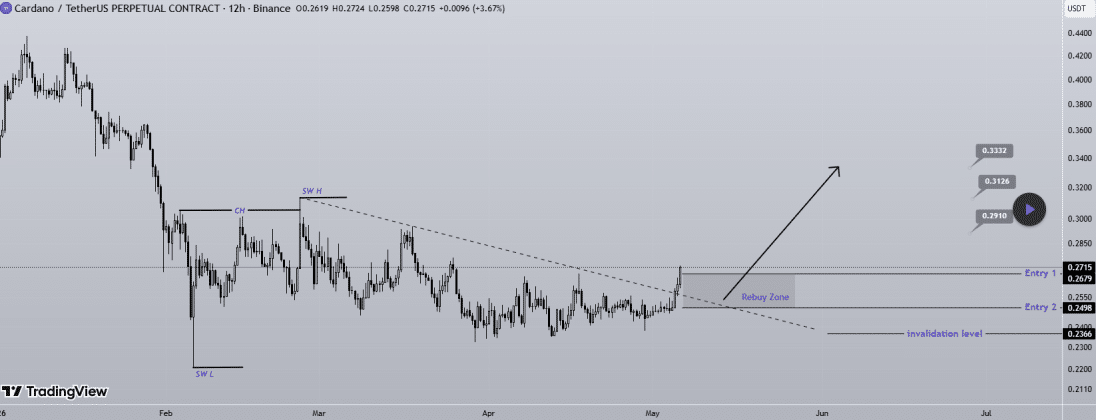
Cardano made a swing low of $0.220 on February 6, and this level remains intact. Additionally, it marked a bullish change in character when it retested and broke above the prior lower high in late February. That combination signaled that selling pressure was fading even before the recent breakout emerged.
Cardano Breakout Opens Path for Higher Prices
Meanwhile, the breakout above the descending resistance trendline now places focus on several upside levels identified in the analysis. The first major area sits near $0.291, followed by resistance around $0.312. If momentum continues to build, the structure also points toward a 27% growth to $0.333.
Meanwhile, the chart highlights two separate entry regions. The first entry zone is at $0.267, near the current market price. The second point in the rebuy zone sits lower, near $0.249. This setup reflects a cautious approach in case short-term volatility pushes $ADA back toward support, or it pulls back to retest the breakout before bullish continuation.
However, the analysis identifies the invalidation level near $0.236. A daily close below that region would weaken the current structure and suggest that bullish momentum has failed.
Spot Flow Suggests Accumulation
An accumulation effort in the past 24 hours has added optimism. Coinglass data show that exchange spot outflows have surpassed inflows, suggesting that holders are moving their $ADA off platforms where they can be easily sold. Outflows stand at $37.7 million and inflows at $36 million.
Cardano’s long/short ratio also highlights a bullish bias among futures traders. The Binance $ADA/$USDT ratio by accounts stands at 2.165, indicating that for every account holding a short position, 2.165 others hold a long position.
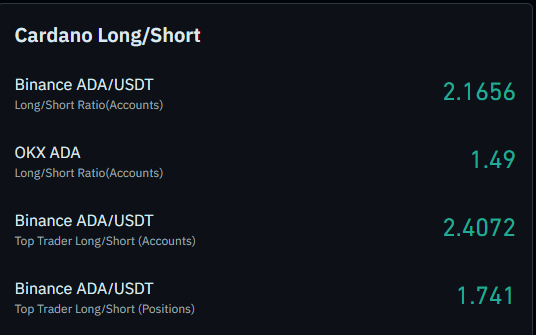
The top trader long/short ratio on the Binance $ADA/$USDT pair also reflects this optimistic outlook. The largest traders on the platform maintain a long-to-short ratio of 1.74, suggesting they expect the coin to rally further.