
After a powerful rally, Toncoin crypto still shows a strong daily trend, but lower timeframes now suggest short-term momentum is starting to cool.
Main scenario: Bullish on the daily chart
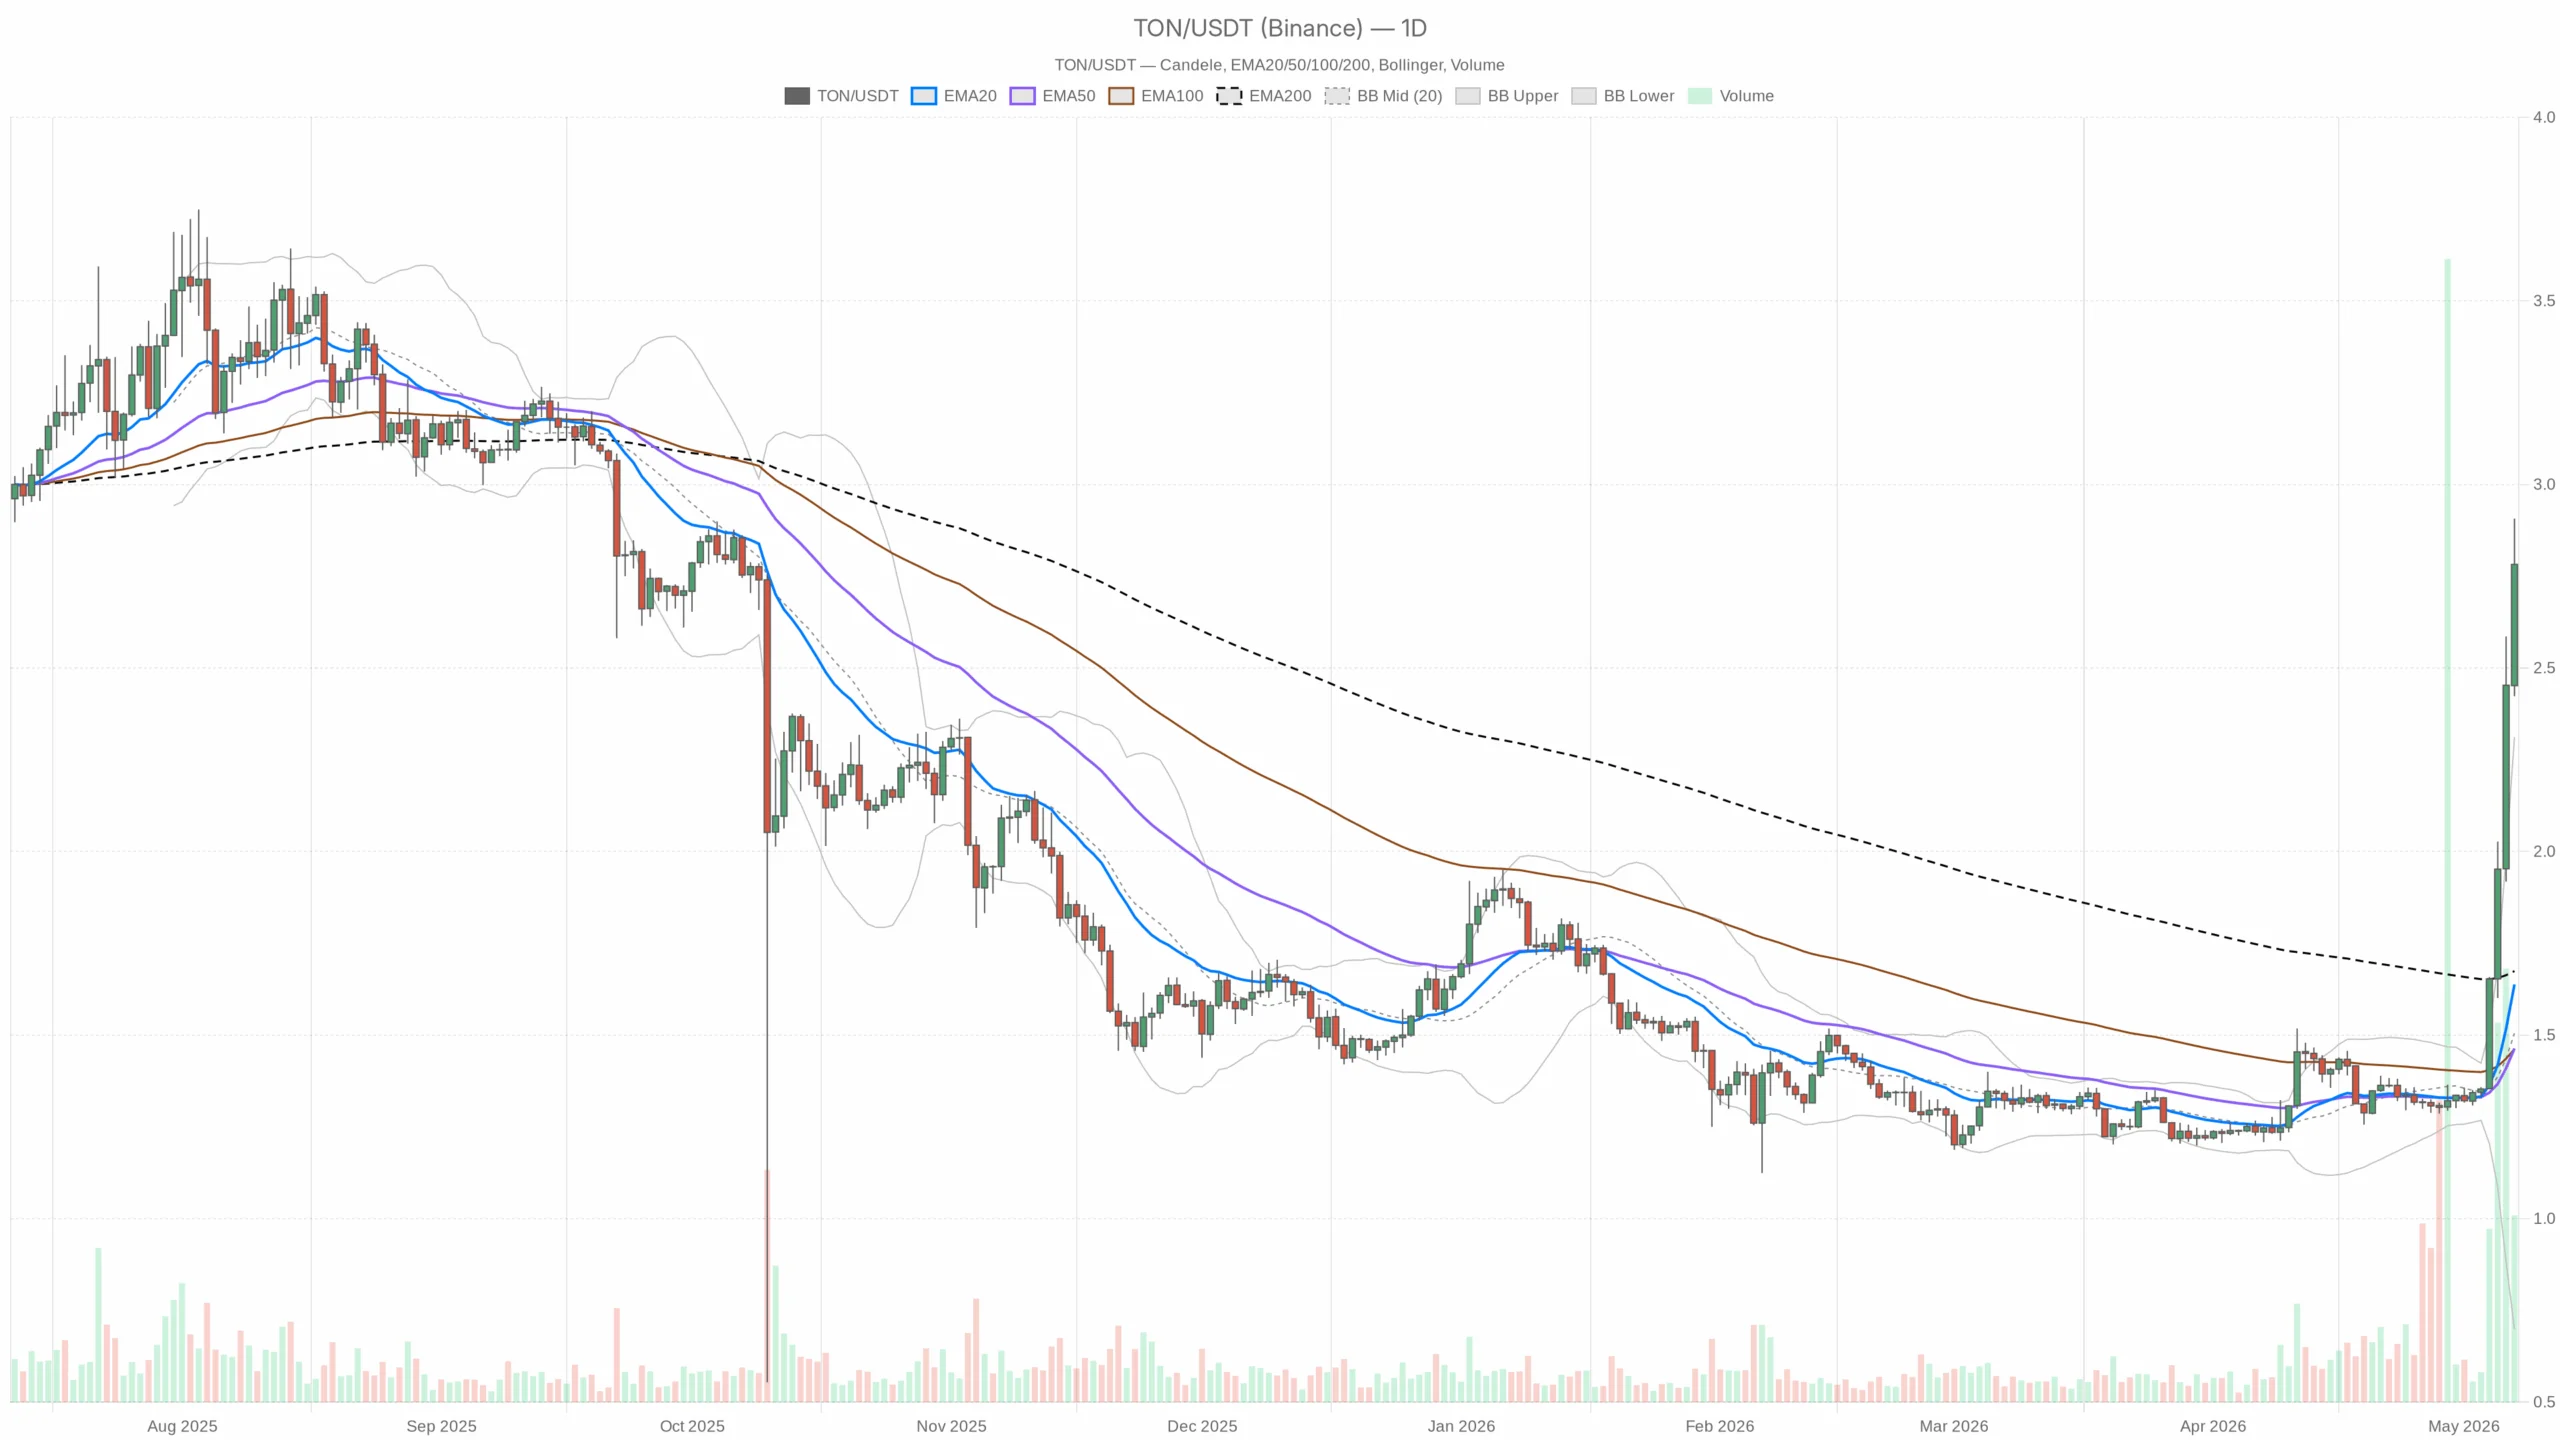
The main scenario for TON is bullish because the daily chart remains firmly trend-led. Price trades at 2.78, well above the 20-day EMA at 1.64, the 50-day EMA at 1.46, and the 200-day EMA at 1.67. That kind of separation does not happen in a weak market.
It reflects aggressive repricing and strong directional control from buyers. At the same time, the distance from those averages shows the move is stretched. Therefore, trend continuation remains the base case, but pullback risk is rising.
The hourly chart still leans constructive, which supports the daily thesis. However, the 15-minute chart shows momentum fading near local resistance. That does not reverse the trend by itself. It simply suggests upside continuation may need consolidation before the next leg.
Daily chart: trend is strong, but overheated
On the daily timeframe, TON is trading in a very extended bullish structure. The moving average stack is cleanly positive, with the shorter EMA above the longer ones and price above all of them. This is exactly what a strong trend is supposed to look like.
The problem is that price is now significantly detached from the trend base, so mean reversion risk is growing even if the broader structure stays intact. Moreover, the RSI on D1 is 93.48, which is an extreme reading.
That tells you buyers have been in full control, but it also warns that the move is crowded and vulnerable to profit-taking. The MACD on D1 remains bullish, with the line at 0.23, signal at 0.08, and histogram at 0.14.
Momentum is still expanding on the higher timeframe, so the trend has not actually broken down yet despite the overbought condition. The EMA structure on D1 is decisively bullish: price at 2.78 versus EMA20 1.64, EMA50 1.46, and EMA200 1.67.
This confirms a strong upside regime, but the gap between price and the averages is wide enough to invite a reset if fresh demand slows. Daily Bollinger Bands show a middle band at 1.50, an upper band at 2.31, and a lower band at 0.70.
Price sits at 2.78, above the upper band. That usually happens during powerful breakouts, but staying above the band for too long often leads to cooling off rather than immediate acceleration. The daily ATR is 0.16.
Volatility is elevated enough to support meaningful directional movement, so even normal pullbacks could be relatively sharp in absolute terms. Daily pivot levels place the main pivot at 2.70, with resistance at 2.99 and support at 2.50.
Price is holding just above the pivot, which keeps control with buyers for now. Meanwhile, Toncoin crypto still needs to protect that area if the broader breakout is to remain intact.
1-hour chart: still bullish, but momentum is less explosive
The 1-hour chart still supports the higher-timeframe trend, but the pace is cooling. TON remains above the 20-hour EMA at 2.54, the 50-hour EMA at 2.24, and the 200-hour EMA at 1.71, which keeps the short-term structure positive.
Buyers have not lost control of the trend. What has changed is the character of momentum: it is no longer expanding aggressively. The RSI on H1 is 70.67, which keeps TON in strong territory.
However, it also says the hourly chart is nearing a point where upside becomes harder to sustain without a pause. The H1 MACD remains positive, with line 0.18, signal 0.16, and histogram 0.02.
Momentum is still bullish, though the small histogram shows the thrust is losing some intensity compared with the daily chart. The EMA alignment on H1 stays bullish, so pullbacks are still likely to be treated as dips unless price loses the 20-hour EMA decisively.
Hourly Bollinger Bands sit at mid 2.52, upper 2.87, and lower 2.16, with price at 2.78. TON is trading in the upper portion of the range, which keeps pressure to the upside.
That said, it is no longer pressing the band in a way that suggests fresh expansion. The hourly ATR is 0.12, so intraday swings are large enough to create false breaks around nearby levels.
Hourly pivot levels show a pivot at 2.80, resistance at 2.88, and support at 2.70. Price is sitting just under the hourly pivot, which weakens immediate momentum slightly.
Reclaiming 2.80-2.88 would reassert control, while slipping under 2.70 would open the door to a deeper intraday retracement.
15-minute chart: execution context, not trend definition
The 15-minute chart is where the first signs of fatigue appear. Price is still above the key short-term averages, so the structure has not rolled over, but momentum is no longer cleanly supportive.
This is the kind of setup where breakouts can fail on a first attempt before the trend resumes later. The RSI on M15 is 55.75, which is neutral to positive.
That means buyers still have room, but the market is no longer in a strong impulsive push on this timeframe. The M15 MACD is slightly soft, with line 0.06, signal 0.08, and histogram -0.01.
Short-term momentum has cooled, so entries taken purely on momentum look less attractive until the market either resets or re-accelerates. The EMA structure on M15 remains bullish with price above the 20 EMA at 2.76, 50 EMA at 2.63, and 200 EMA at 2.23.
The trend is still intact even though momentum is softening, which is a classic sign of consolidation rather than confirmed reversal. On 15-minute Bollinger Bands, the mid is 2.78, the upper band is 2.90, and the lower band is 2.66.
Price is sitting around the mid-band, which reflects balance rather than directional urgency in the very short term. The M15 ATR is 0.08, so even the execution timeframe has enough volatility to shake out weak positioning.
The 15-minute pivot is 2.77, with resistance at 2.80 and support at 2.75. Price hovering around the pivot shows the immediate auction is balanced.
A clean move above 2.80 would favor another attempt higher, while losing 2.75 would confirm near-term softness.
Market backdrop and TON-specific flow
The broader crypto market is not in a full risk-on frenzy. Total market cap is only marginally higher over the last 24 hours, Bitcoin dominance remains elevated at 58.64%, and fear and greed sits at 47, which is neutral.
That matters because TON’s strength is not simply coming from a broad altcoin melt-up. It looks more like asset-specific demand and ecosystem-driven interest. Moreover, that view is reinforced by TON ecosystem fee activity.
STON.fi and TONCO have posted very sharp fee growth over the last week and month. That points to a real pickup in network usage and speculative participation around the TON ecosystem, which helps explain the outperformance in a mixed market environment.
Bullish scenario
The bullish case remains straightforward: TON holds above the daily pivot at 2.70, absorbs the current overbought condition through time rather than price, and then pushes into 2.88 on the hourly chart before challenging the daily resistance at 2.99.
If buyers secure a break above 2.99, the market would likely treat recent consolidation as continuation rather than exhaustion. However, what would invalidate the bullish case is a decisive loss of 2.70 on the hourly structure, followed by a break of 2.50 on the daily map.
That would be the first serious warning that the move is no longer just cooling off. At that point, the market would be shifting from trend continuation into a deeper reset.
Bearish scenario
The bearish case is not that the higher-timeframe trend has already reversed. It is that the move has become too stretched to sustain at the current pace.
The daily RSI is extreme, price is above the daily upper Bollinger Band, and the 15-minute MACD is already fading. If TON fails repeatedly around 2.80-2.88 and slips under 2.70, sellers could force a retracement toward 2.50.
A deeper washout could then drag price closer to the hourly mid-band region and potentially toward the daily EMA20 over time if momentum unwinds hard enough. What would invalidate the bearish case is a clean recovery back above 2.80, followed by acceptance above 2.88 and then a breakout through 2.99.
In that case, the market would remain trend-dominant rather than mean-reverting.
Positioning takeaway
TON is still a bullish market on the daily chart, but it is no longer a low-risk chase. The bigger structure favors buyers, while the lower timeframes are warning that timing now matters more than direction.
That is an important distinction. When a market gets this extended, being right on trend does not guarantee being right on entry. Therefore, the practical read is simple: bulls still have the stronger chart, but they need price to defend 2.70 and eventually clear 2.88-2.99 to keep control.
Bears, meanwhile, do not yet have a reversal, only an argument for a pullback. With volatility elevated and momentum split across timeframes, this remains the kind of environment where overconfidence gets punished quickly.