
Solana is trading near a key price zone as two charts show the same main setup: $SOL has stopped making large moves and now sits inside a tight range. One chart shows three months of low volatility near $85, while another places Solana close to a support zone that started a major rally in the last cycle. Together, the charts suggest that $SOL may be building pressure for a larger move, but the direction depends on whether price breaks above resistance or loses support.
Solana Compression Signals Bigger Move After Three Month Range
Solana traded near $84.82 on the 3 day $SOL/$USDT perpetual chart shared by Daan Crypto Trades. The chart shows $SOL moving inside a tight range after a sharp decline earlier in 2026.
The price has stayed near the same zone for about three months, with the main range sitting around the high $70s to mid $90s. A dotted support line appears near $78.85, while the upper part of the range sits close to the $95 to $100 area.
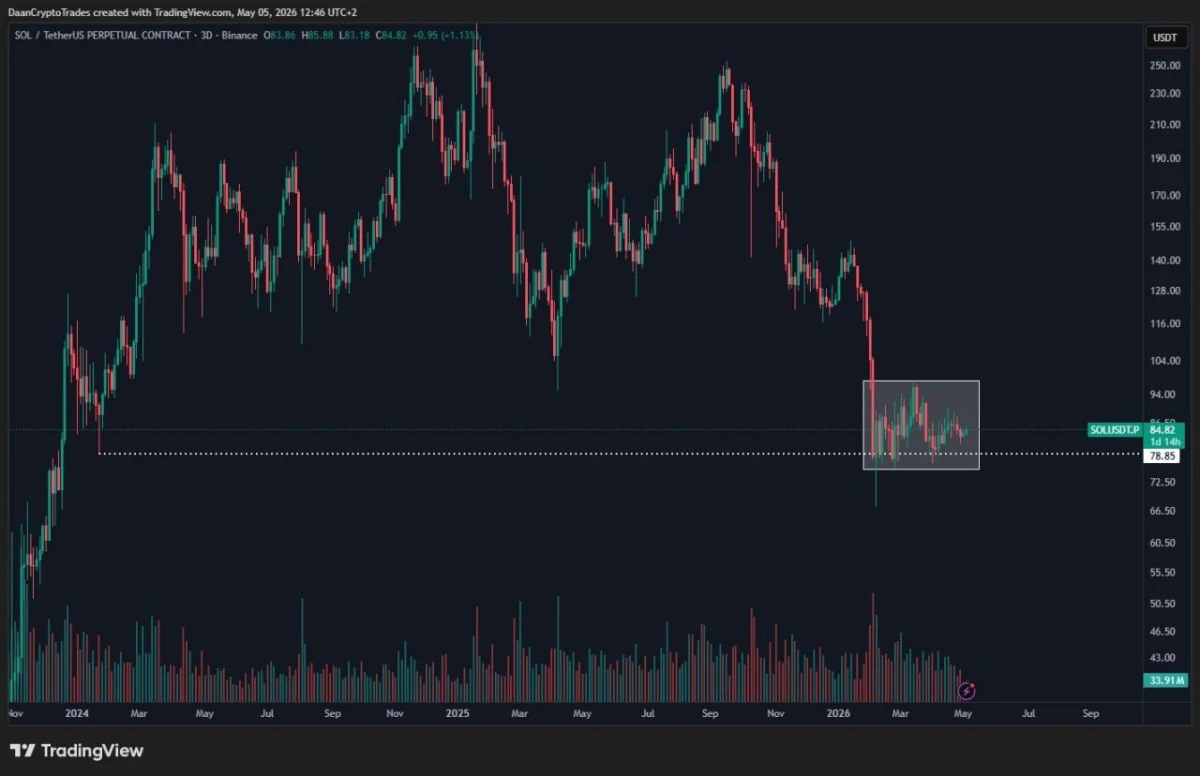
Solana Range Compression Chart. Source: Daan Crypto Trades on X
Daan Crypto Trades said $SOL has been stuck in a roughly 10% range for three months. He also noted that Solana is seeing its lowest volatility in years. That means price movement has become narrow compared with previous $SOL market cycles.
The chart shows this compression clearly. After strong price swings in 2024 and 2025, $SOL now moves sideways inside a small box. However, long periods of low volatility often come before a larger move, because buying and selling pressure builds while price stays trapped.
The next direction depends on which side breaks first. If $SOL breaks above the upper range with a clear 3 day candle close, buyers could push the price toward a larger recovery leg. However, if $SOL loses the lower range and drops below the $78 area, sellers could take control again.
Daan said the move after the breakout may reach 20% to 30%. Based on the current price near $85, a 20% move higher would place $SOL near $102, while a 30% move would put it near $110. A similar move lower would place $SOL near the $68 to $64 zone.
For now, the chart does not confirm a breakout. Solana remains inside the compression zone, and the next strong move depends on a clean break above resistance or below support.
Solana Returns to Buy Zone as Chart Maps $1,000 Target
Solana traded near $85.57 on the weekly $SOL/$USDT chart shared by Crypto Patel. The chart shows $SOL sitting close to a marked support and entry zone, after falling from the upper range near the $200 area.
Crypto Patel said Solana is back near the same buy zone that preceded a major rally in the last cycle. The chart compares the current area with the 2023 breakout and retest zone, where $SOL later moved sharply higher.
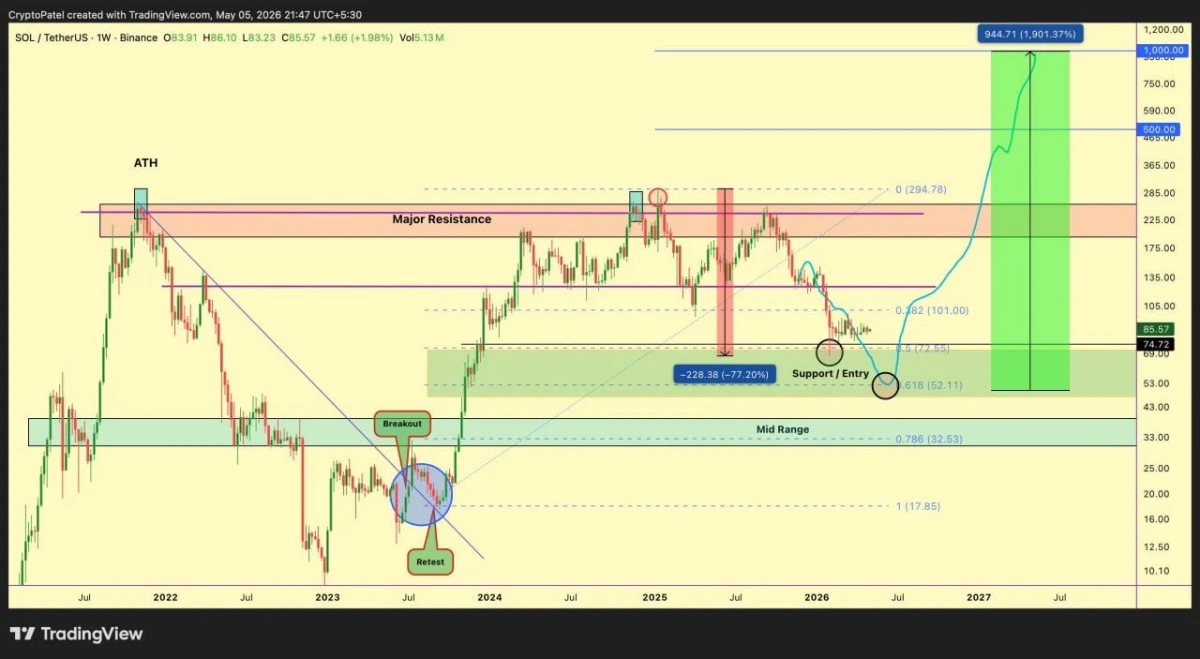
Solana Buy Zone Chart. Source: Crypto Patel on X
The support area sits around $52 to $72, based on the Fibonacci levels shown on the chart. $SOL is now trading above that zone, while the nearest marked price level appears near $74.72.
The chart also shows a 0.618 Fibonacci level near $52.11, a 0.5 level near $72.55, and a 0.382 level near $101.00. These levels mark possible areas where price could react if $SOL moves lower or starts recovering.
The main resistance remains much higher. Crypto Patel marked a major resistance zone around the $225 to $285 area, near Solana’s previous cycle highs. The chart also shows upside levels at $500 and $1,000, with a projected move pointing toward the top target.
However, $SOL has not confirmed that larger breakout yet. The price still needs to recover above the lower resistance area near $101, then reclaim stronger zones near $135 and $225 before the $500 and $1,000 targets become chart relevant.
The projected path shows a possible rally of about 1,901% from the lower support zone toward $1,000. Still, the chart presents this as a technical scenario, not a confirmed move.
For now, Solana remains near a key weekly support region. A strong hold above the buy zone could support a recovery setup. However, a breakdown below the $52 to $72 area would weaken the bullish structure shown on the chart.