
Ripple ($XRP) is edging lower for a second consecutive day, below its weekly peak of $1.40 and trading at around $1.33 at the time of writing on Thursday. The remittance token aligns with the broader crypto market’s outlook, which appears largely defined by increasing doubts over the United States (US) and Iran’s ceasefire deal.
Although holding, the ceasefire remains edgy, with Iran still blocking passage through the Strait of Hormuz and US President Donald Trump warning that strikes will continue if Iran does not strike a deal.
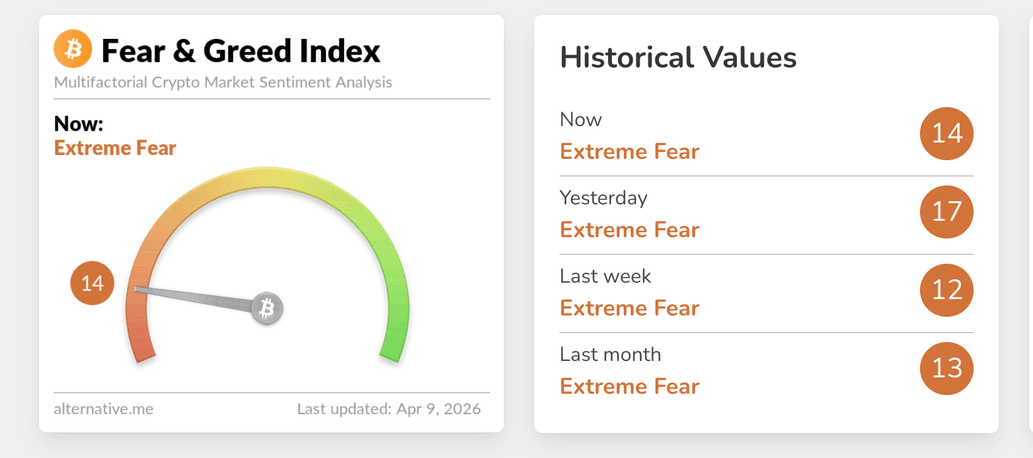
Crypto market sentiment has significantly deteriorated since the war broke out in late February, as reflected in the Fear & Greed Index, which reads 14 in the extreme fear region on Thursday, down from 17 the previous day. This outlook shows that investors lack conviction in the broader market’s ability to sustain short to medium-term recovery.
$XRP falters, weighed down by weak derivatives
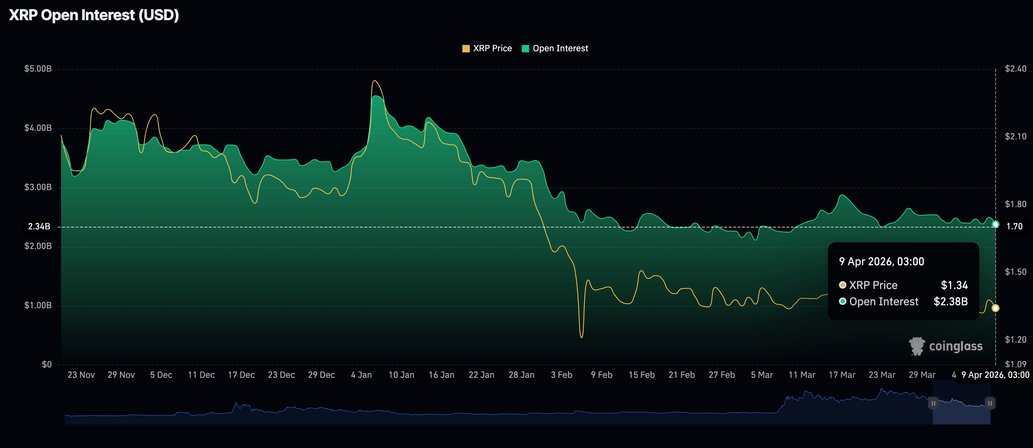
Retail demand is weakening, as Open Interest (OI), which reflects the value of outstanding futures and options contracts, falls to $2.38 billion on Thursday from $2.50 billion the previous day. If the decline persists, $XRP will likely remain confined to the broader downtrend toward support at $1.30.
Technical outlook: $XRP faces increasing downside risks as technicals falter
$XRP is trading at roughly $1.33, under clear downside pressure, with price holding beneath the 50-day, 100-day, and 200-day Exponential Moving Averages (EMAs) at $1.42, $1.58, and $1.83, respectively, which keeps the broader trend tilted to the downside despite the recent bounce.
The Relative Strength Index (RSI) near 44 on the daily chart suggests only modest negative bias rather than outright oversold conditions, while the Moving Average Convergence Divergence (MACD), hovering just above the zero line, hints at tentative recovery attempts that are still capped by a solid overhead structure.
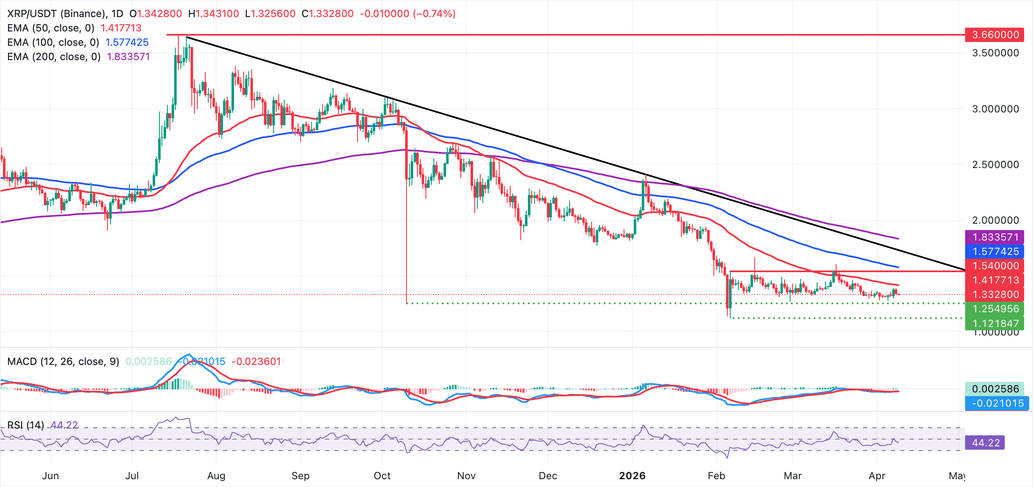
On the topside, $XRP's initial resistance is at the 50-day EMA around $1.42, with further hurdles at the 100-day EMA near $1.58 and the descending trendline break zone around $1.73. The 200-day EMA at $1.83 reinforces this broader supply band that would need to be reclaimed to ease the bearish backdrop.
With no clearly defined moving-average support levels on the daily chart, traders may look to recent swing lows at $1.30 and $1.28 for interim floors, while recognizing that the dominant risk remains and that rallies will likely fade against these layered EMAs until buyers can secure a sustained daily close above the first resistance cluster.
(The technical analysis of this story was written with the help of an AI tool.)