coinpedia.org
A prediction making rounds on social media this week claims $XRP could hit new all-time highs above $4 within six days, pointing to a weekly chart squeeze as the primary signal. The claim has picked up traction in the $XRP community, though analysts who follow the token closely are offering a more neutral perspective.
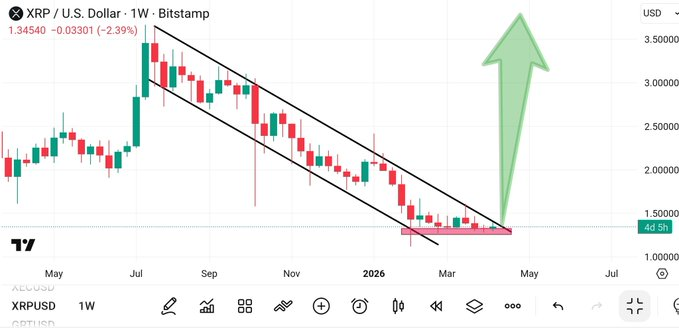
$XRP is currently trading around $1.34, down 2.39% on the week.
What the Chart Actually Shows
Looking at the weekly chart, $XRP has been trading inside a descending channel since its peak above $3.50 in mid-2025. The price has been grinding lower through a series of lower highs and lower lows, with the channel tightening noticeably in recent weeks. The pink highlighted zone on the chart marks the current compression area, with a large green arrow pointing toward a potential breakout above $1.50 and beyond.