The first immediate resistance stands at $12.07, which aligns with the 23.60% Fibonacci retracement level. That level also collides with the 200-week moving average, making it one of the most important barriers on the chart.
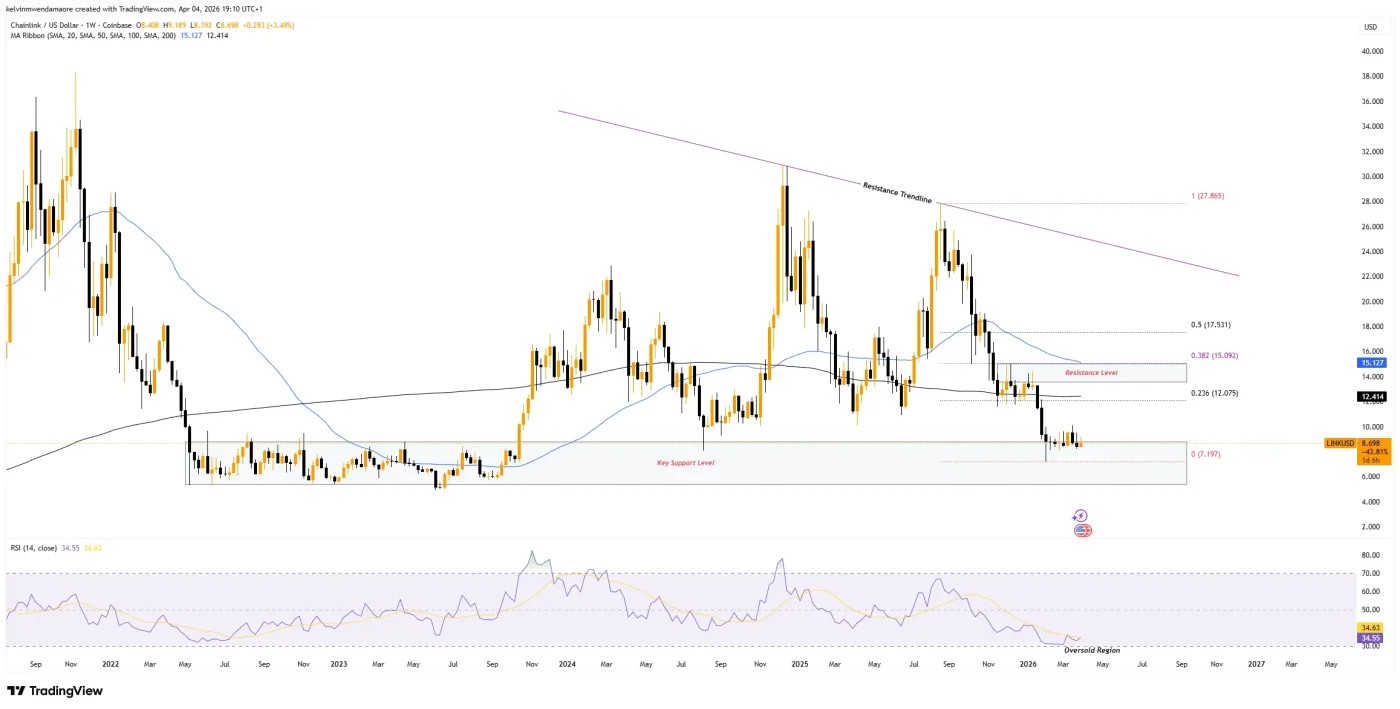
Chainlink 1-Week Price Chart (Source: TradingView)
Above that, the second resistance zone stretches from $13.56 to $15.08 and overlaps with the 38.60% Fibonacci retracement. That region previously attracted heavy supply pressure and marked the point where buyers lost control.
In that area, the market recorded a decline of more than 50%, returning to the current support structure. The rejection left the token trading below both its medium-term and long-term moving averages, now positioned at $12.41 and $15.12.
Momentum Indicators Show Weakness but Stable Structure
Momentum readings continue to reflect pressure, though not disorderly volatility. The relative strength index stood at 34, leaving $LINK in the oversold region and showing that downside momentum remained elevated.
At the same time, the RSI was moving upward and nearing its signal line. That setup highlighted a slight improvement in momentum conditions, even though the price remained below major moving-average resistance levels.
The broader chart also showed a tight consolidation pattern with fading volatility. A descending trendline from prior highs continued to cap recovery attempts, while the daily structure remained indecisive and range-bound.
That same tone appeared in commentary from market analyst CRYPTOWZRD, who said Chainlink closed the session without conviction. The analyst added that the next meaningful move may depend on the LINKBTC pair and changes in Bitcoin dominance.
Derivatives Data Reflects a Wait-and-See Market
On the same accord, on-chain and derivatives data pointed to a market that has largely paused rather than accelerated. According to CoinGlass data, open interest has moved sideways from the fourth quarter of last year through the present period.

Chainlink Futures Open Interest (Source: CoinGlass)
At press time, open interest read $360 million, showing limited expansion in futures positioning. That flat trend indicated fewer fresh entries into the market and matched the lack of large directional price swings.
The same pattern appeared in futures volume, which has also tracked sideways during the same period. The latest 35% daily drop to $373 million reinforced the cautious tone already visible in spot volume.

Chainlink Futures Volume (Source: CoinGlass)
Together, those figures indicated that Chainlink remained trapped between heavy overhead resistance and a deeply tested support base. With the cryptocurrency holding near $8.71, the market stayed compressed, data-driven, and tightly focused on whether volume returns.

 cryptonewsz.com