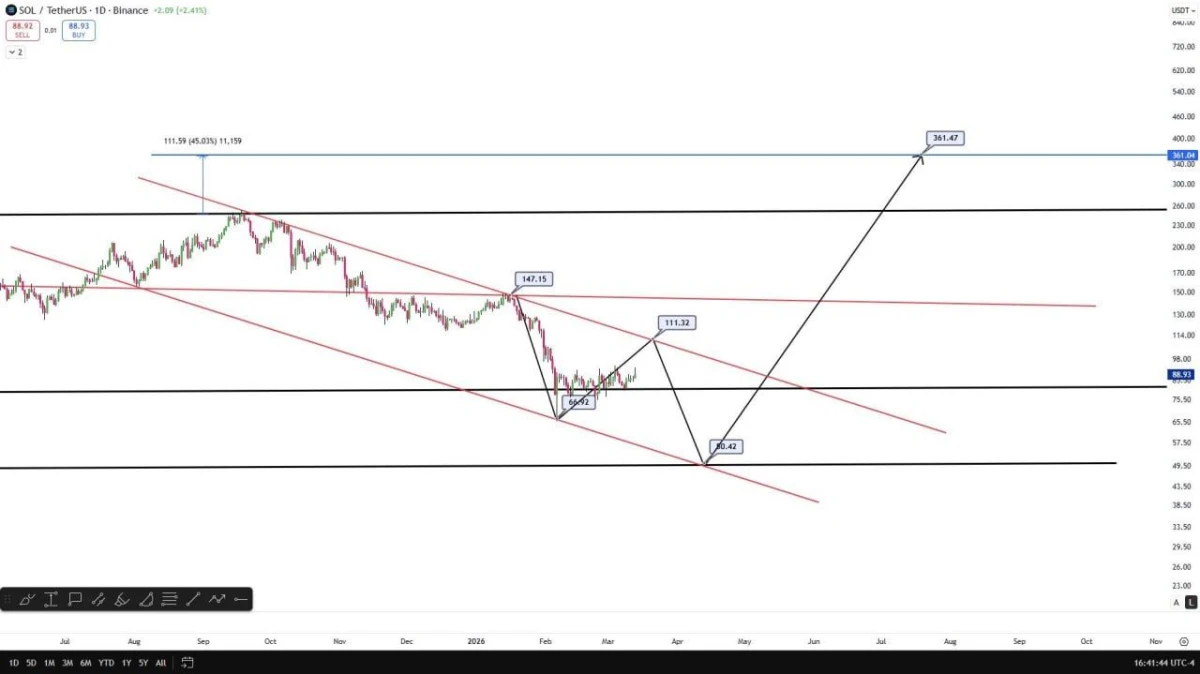
$SOL/$USDT 1D Chart: Source: Celal Kucuker on X
The chart used a descending channel and several horizontal levels to frame Solana’s broader structure. According to the setup, Solana first fell toward the $66 area, then bounced and moved toward a projected zone near $111.32. That level appeared to align with descending resistance, making it an important test area before any stronger move higher could develop.
At the same time, the chart also kept a lower path open. After a possible move toward $110, the projected line showed Solana dropping toward roughly $50.42 before reversing sharply. From there, the longer term path pointed to a breakout rally that could eventually extend toward the $361 area, well above the upper resistance band marked near $250 and the blue target line around $361.04.
The main takeaway from the chart was that Solana remained inside a broader corrective structure even though a rebound was underway. As a result, the analyst’s roadmap suggested that short term upside toward $110 may come first, but that the market could still face another deep drop before any larger bullish breakout attempt.
Solana Chart Signals Recovery Attempt as Analyst Maps Route to Higher Resistance
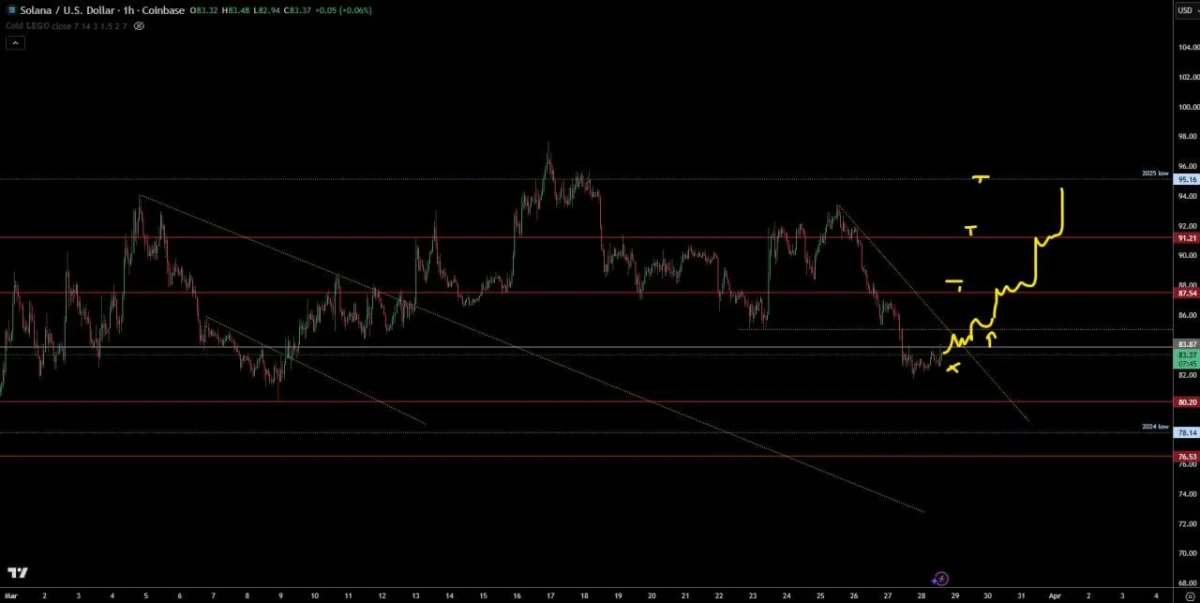
A one hour Solana chart shared by X user TraderSZ pointed to a possible recovery setup after a recent decline into support. The Coinbase $SOL/USD chart showed Solana moving near a lower horizontal zone while the analyst marked a projected rebound path that could carry price back through several resistance levels if momentum strengthens.
$SOL/USD 1H Chart: Source: TraderSZ on X
The chart highlighted a descending trendline from the recent highs, with the projected move showing Solana first reclaiming that falling resistance before testing the next horizontal barrier. From there, the path suggested a stair step advance toward higher levels around the marked resistance zones near $87.54, $91.21, and the 2025 low area near $95.16.
Support zones also stood out clearly on the chart. The green horizontal area marked the first level Solana needed to defend, while lower support bands near $80.20, $78.14, and $76.53 remained in view if the recovery attempt fails. As a result, the setup framed the current move as an early rebound effort rather than a confirmed breakout.
The broader message from the chart was that Solana may be trying to reverse short term weakness, but it still needs to clear descending resistance and reclaim overhead levels before bulls can argue for a stronger trend shift. Until then, the structure remains a recovery attempt inside a market that recently traded lower.

 coinpaper.com