Double Bullish Divergence Signals Fading Sell Pressure
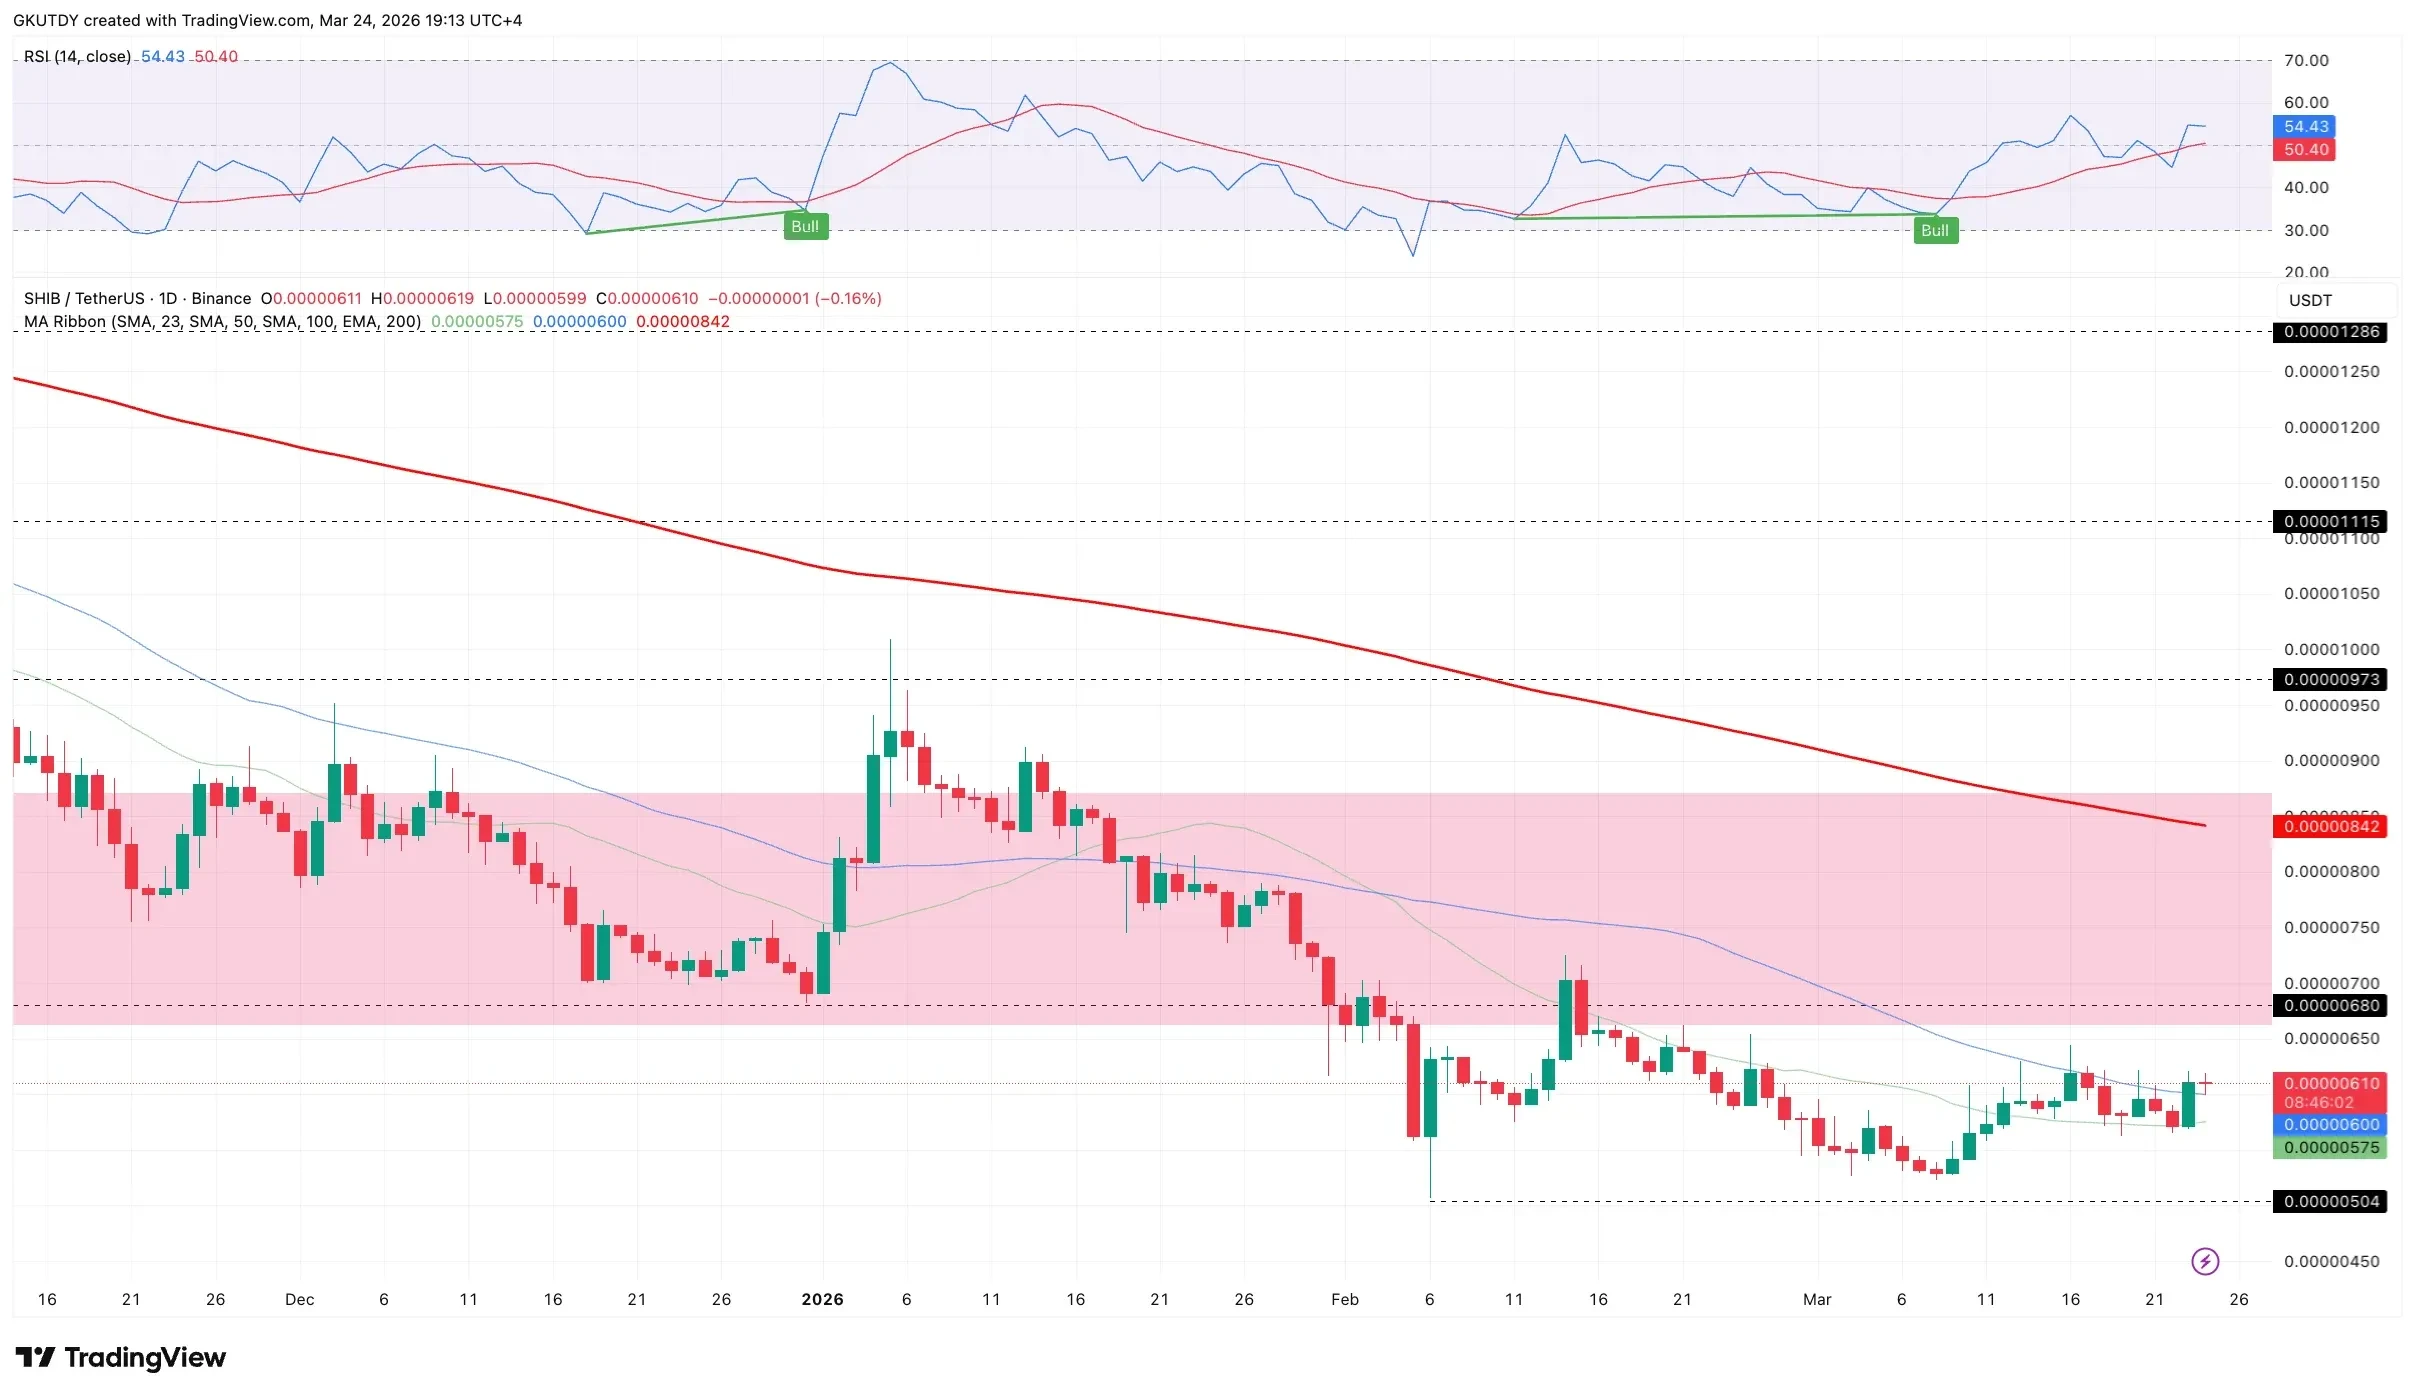
One of the most compelling signals emerging on the $SHIB/USDT chart is a double bullish divergence on the Relative Strength Index (RSI). The indicator has printed a bull mark twice over the past month. This pattern typically suggests that while price action remains flat or declining, underlying momentum is quietly shifting in favor of buyers.
Such divergences do not guarantee a breakout. However, they do indicate that sellers are losing control. Buyers appear to be slowly accumulating $SHIB at current price levels. This type of quiet accumulation often precedes sharper moves once a clear trigger emerges.
The price also broke above the $0.00000504 level, a range boundary that previously capped upside attempts. A sustained hold above this level on higher timeframes would confirm the breakout is legitimate. Traders are watching for a weekly close above this zone before positioning more aggressively.
Key Resistance Levels Define the Road Ahead
Should bullish momentum build, $SHIB faces a series of resistance levels that will define the extent of any recovery.
The immediate target sits at the $0.00000662 resistance zone. This level aligns with prior price consolidation and is likely to attract selling interest on the first approach. A clean break above it could accelerate buying activity.
The primary target for bulls is the 200-day moving average, currently positioned near $0.00000842. That represents a potential gain of approximately 37% from current levels. In crypto markets, a 37% move in a short period is far from unusual, particularly for a high-volatility asset like $SHIB.
A critical threshold approaching on the calendar is the end of the first quarter. If $SHIB closes above $0.0000068 before that deadline, analysts suggest it could act as a technical trigger, prompting a wave of momentum-driven buying. Breakouts that align with quarter-end closes tend to carry more weight with institutional and algorithmic participants.

 coinpaper.com