
Solana ($SOL) is trading at $90, down 1.09%, as its ascending trendline and the $100 target remain out of reach.
Two on-chain indicators confirm the buyer base behind this recovery is thinner than the price chart suggests, with the $96 Fibonacci cluster acting as the line separating a stall from a genuine breakout.
New Addresses Pull Away From Solana
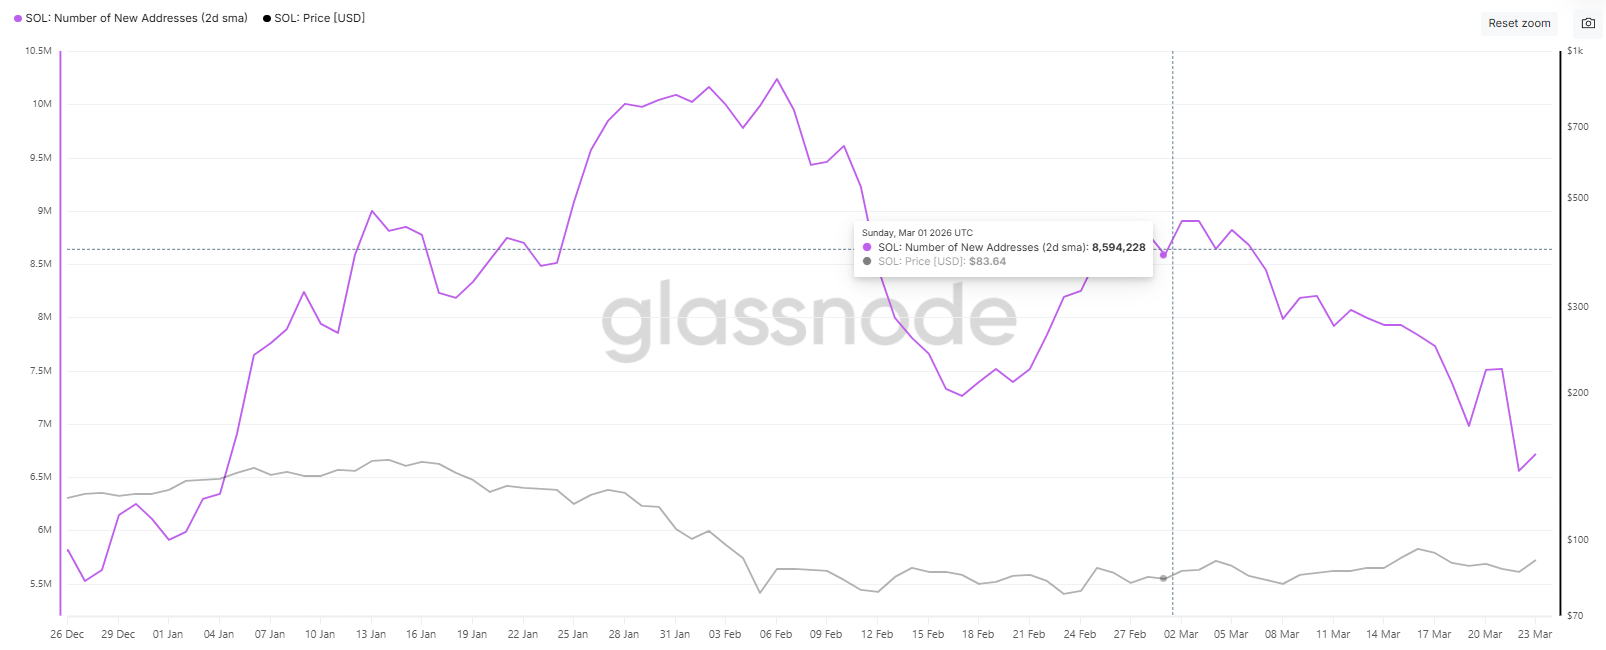
Glassnode data shows Solana was attracting approximately 8.6 million new addresses per day in early March. By late March, that figure dropped to approximately 6.5 million — a 21% decline. The fall has been steady and uninterrupted as the price attempted to recover.
New addresses proxy fresh capital entering the network. When Solana price climbs while new address creation falls, existing holders are driving the move rather than new participants. Recoveries built on existing holders tend to run out of fuel before reaching key resistance.
Want more token insights like this? Sign up for Editor Harsh Notariya’s Daily Crypto Newsletter here.
The current reading constrains the $100 thesis directly. A genuine breakout past $96 would require new address creation to reverse and expand. That reversal has not started.
Sellers Continue To Absorb Recovery Attempts
The Chaikin Money Flow (CMF) registered a clear bearish divergence across the entire recovery. Between February 25 and March 24, CMF peaked near +0.16 as the price reached approximately $90.
That pattern is an exaggerated bearish divergence. Solana price was printing equal highs. The volume-weighted buying pressure behind each push was shrinking, and sellers were absorbing every advance with increasing force.
The CMF now reads -0.04, confirming that sellers are closing daily candles in the lower portion of the range. Combined with the 21% drop in new addresses, this recovery lacks the demand depth to break through $96 and reach $100.
$SOL Price May Struggle To Reach $100
Solana consolidates near $90, between the $85 support floor and the ascending trendline converging toward the $96 Fibonacci 0.382 level. The annotated red circle on the chart marks the $96–$100 zone as the critical resistance cluster. Based on the CMF divergence and declining new addresses, the bearish case is that price stalls and reverses in that zone rather than breaking through.
The Coin Days Destroyed (CDD) data is the key input that could change this. The only major CDD spike hit approximately 3.5 billion on March 5, coinciding with the cycle low — old $SOL coins moving during maximum fear. Since then, CDD has returned to routine readings of 100–300 million per day, with no new spike on March 24. Long-term holders are not distributing, which keeps one layer of sell pressure contained.
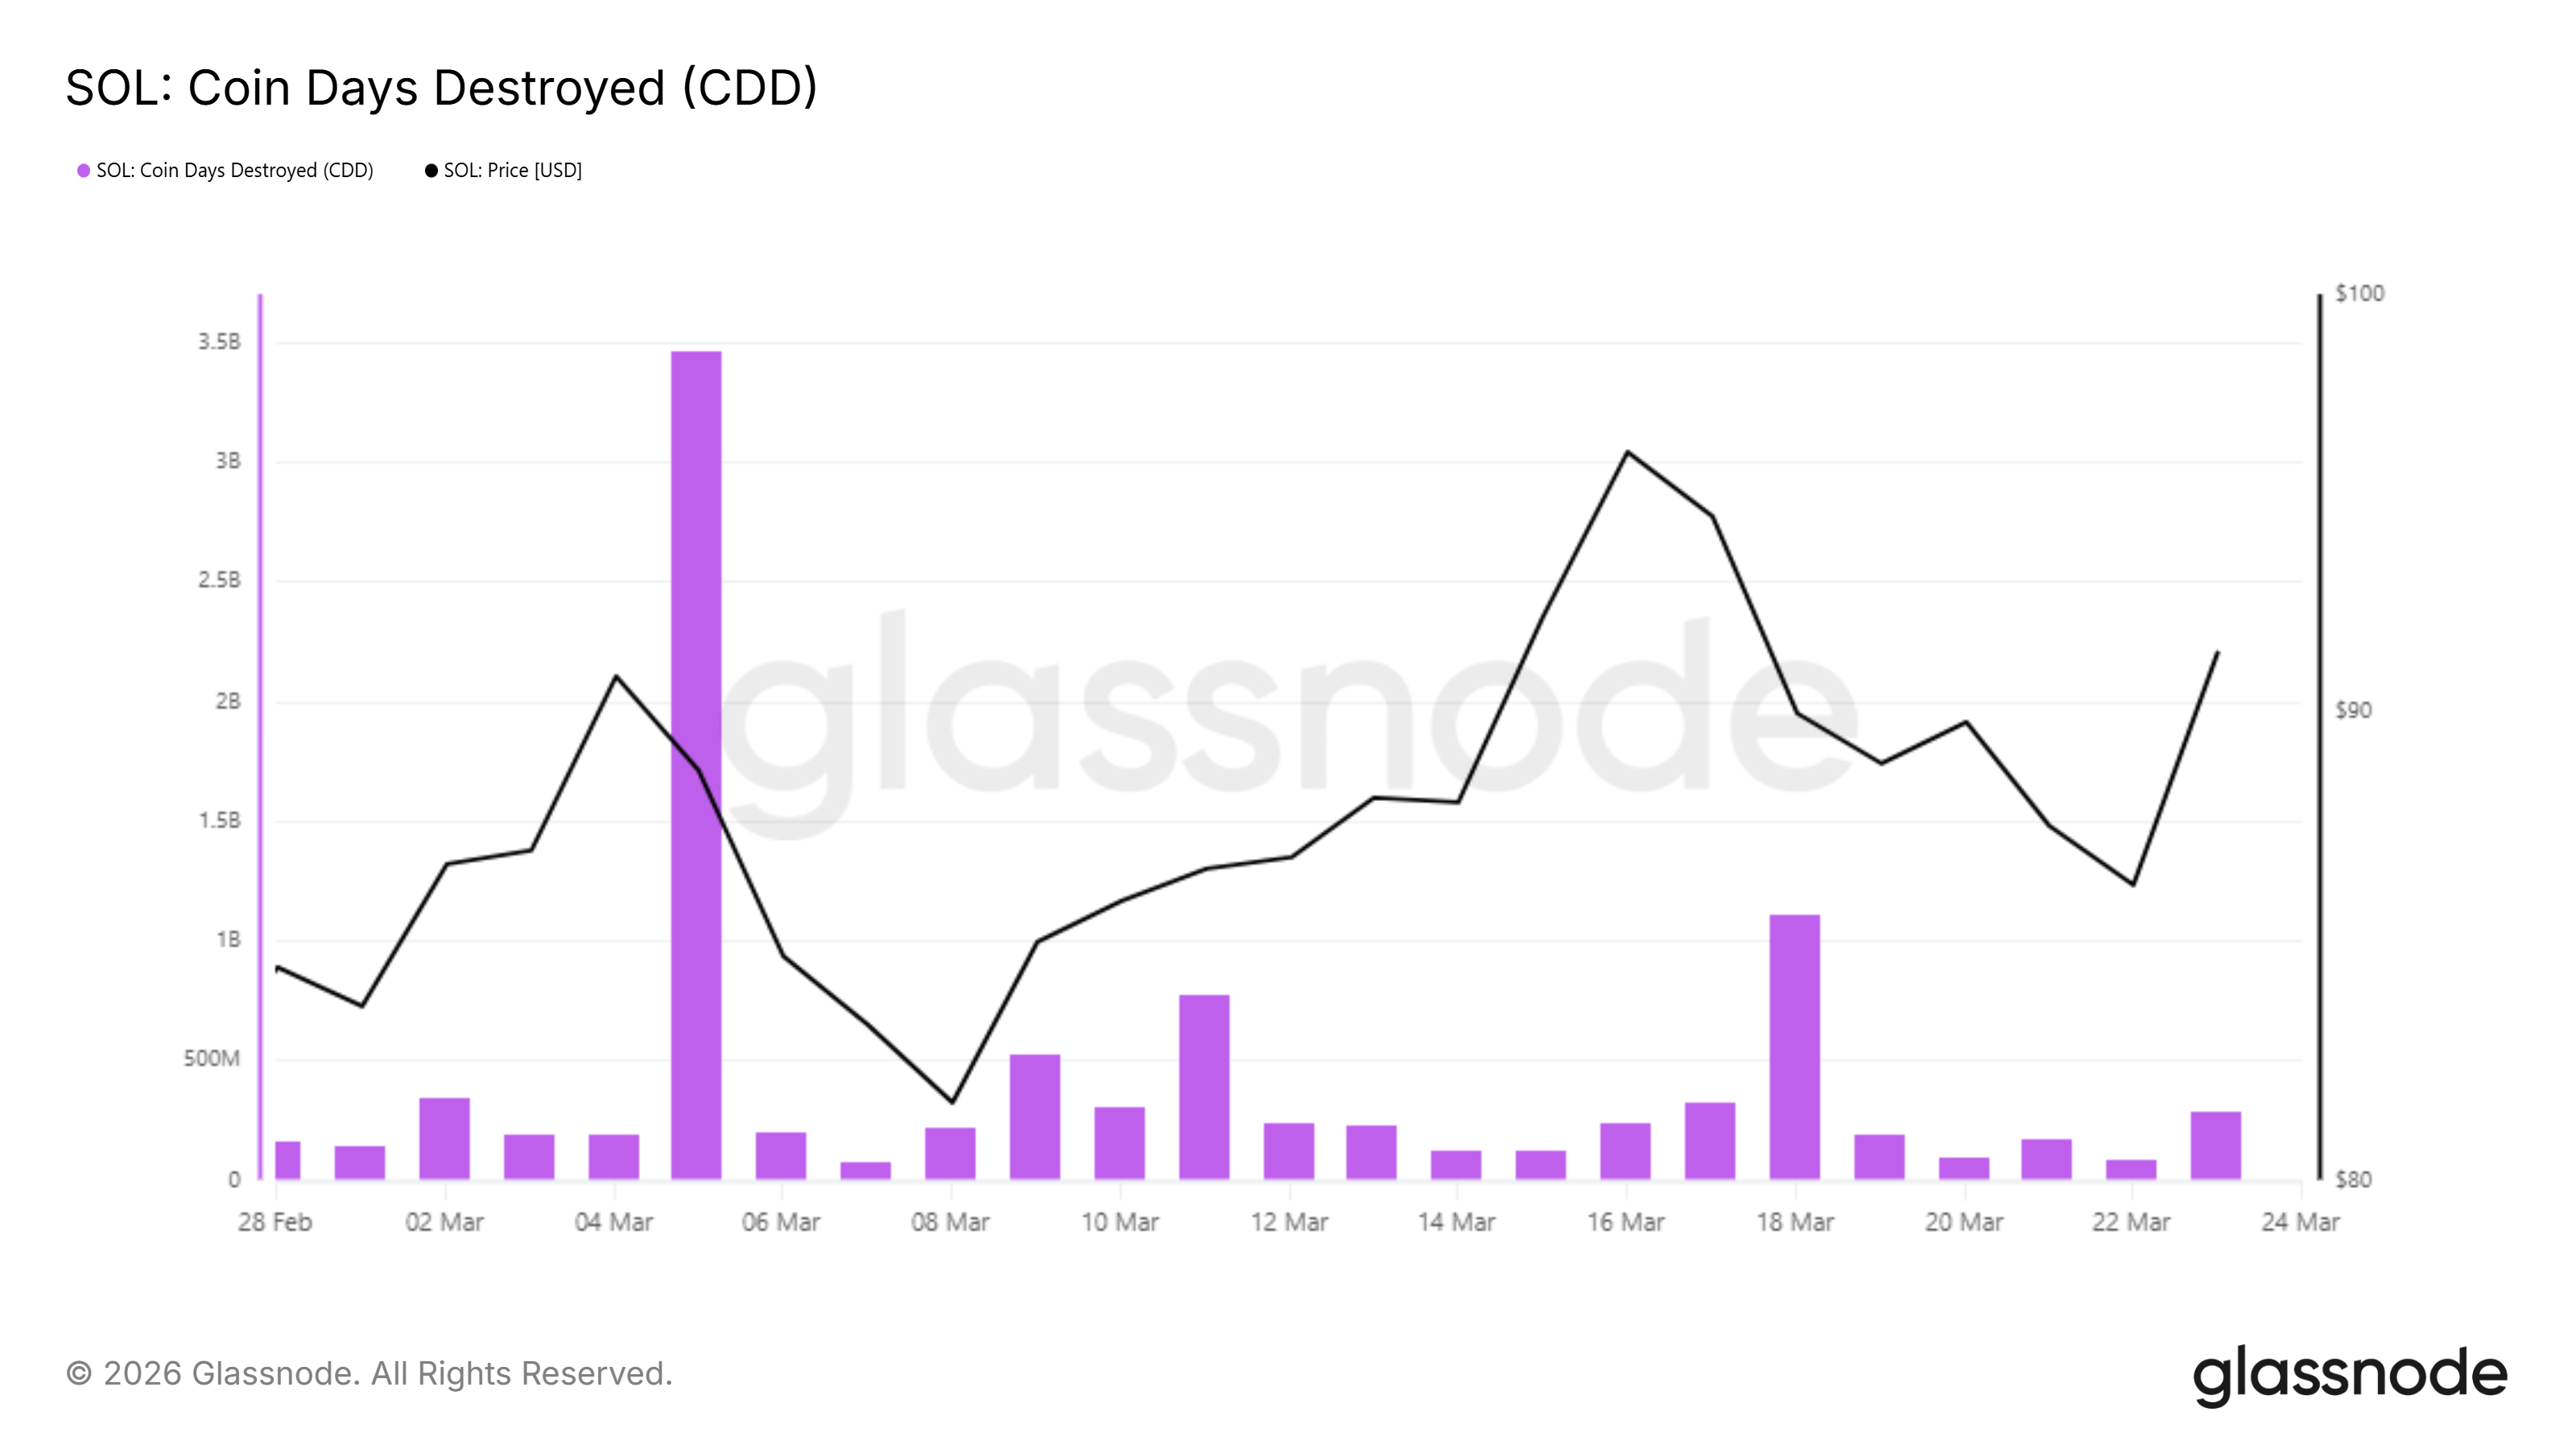
The invalidation rests on CDD. A new spike approaching 3.5 billion coin days, combined with a daily close above $96, would signal long-term holders moving coins into strength rather than sitting still. That combination would open $103 and $108 as the next Fibonacci targets, provided the 0.5 Fibonacci of $100 is breached first.
The post Solana Price’s Rise To $100 Under Threat by 21% Pullback From Key Holders appeared first on BeInCrypto.