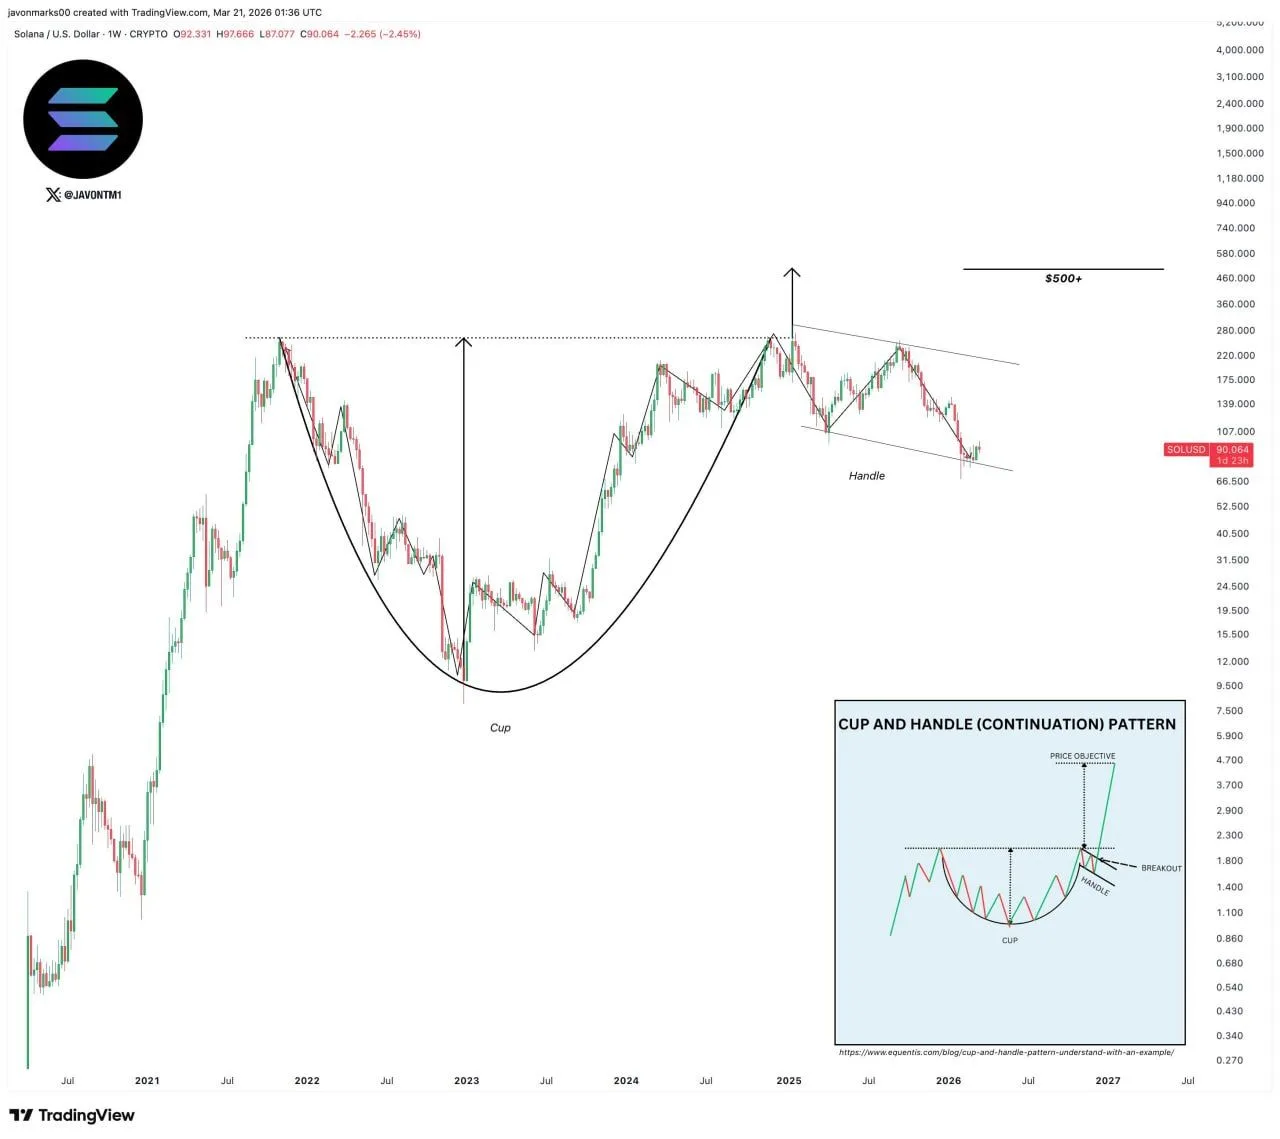
Solana Cup and Handle Pattern: Source: Javon Marks
In technical analysis, a cup and handle pattern is often viewed as a continuation structure. Here, the chart suggests Solana may be consolidating before a larger upward move. The handle sits in a descending channel, while the earlier high near the rim of the cup acts as the key breakout zone.
For now, the bullish target remains conditional. Solana still needs to break above the handle resistance and reclaim the cup rim with strong momentum before the pattern can confirm. Until then, the chart presents a bullish long term structure, but not a completed breakout.
Solana chart signals base building as momentum begins to turn
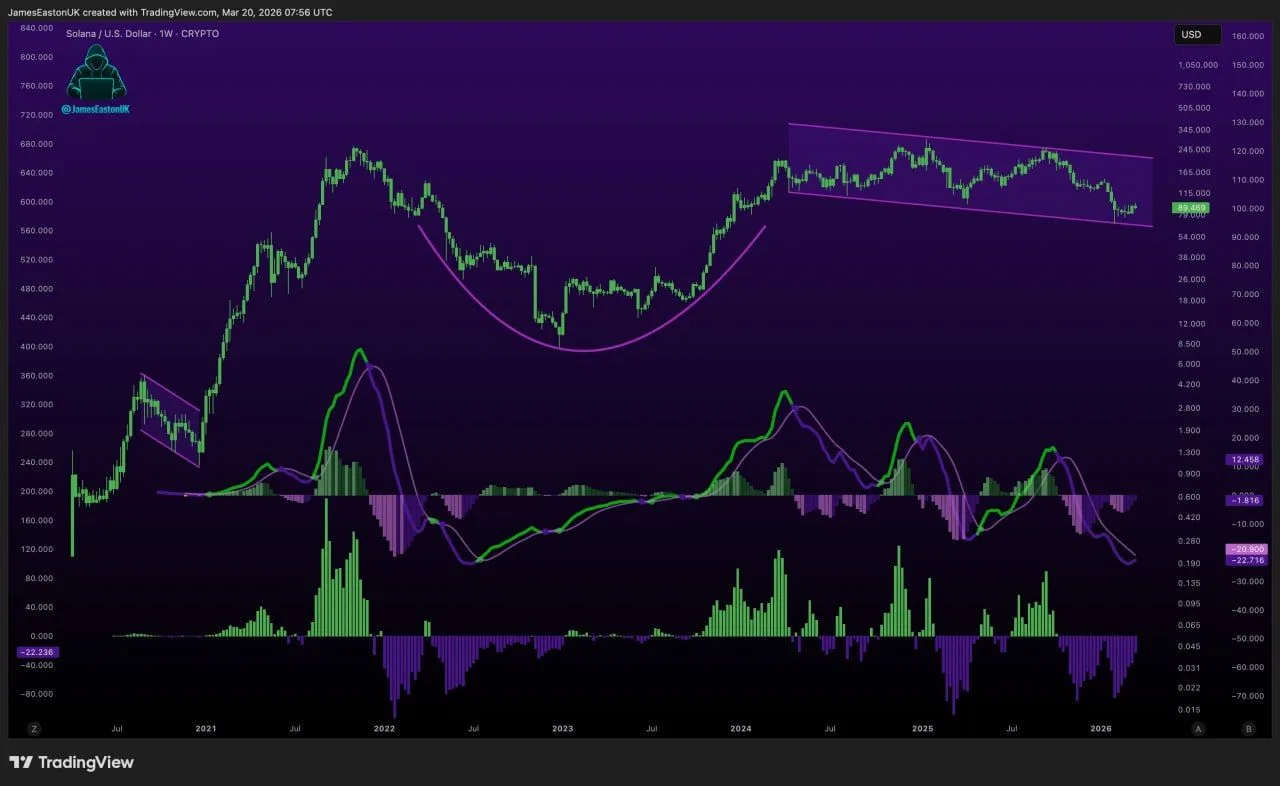
A chart shared by James Easton shows Solana trading inside a descending channel after a broader recovery, while momentum indicators below the price chart suggest bearish pressure may be easing. The setup combines a rounded base structure with a consolidation phase, which often appears when an asset pauses before its next larger move.
Solana Descending Channel and Momentum Structure: Source: James Easton
Moreover, the chart’s lower panel shows momentum cycles that previously turned higher after deep negative readings. That matters because the latest setup appears to be approaching a similar zone, which may suggest selling pressure is weakening even though the broader channel still caps the price structure.
For now, the chart does not show a confirmed breakout. Instead, it shows a market still consolidating within resistance boundaries while momentum tries to stabilize. Therefore, the structure supports a cautiously bullish view over the longer term, but Solana still needs to break out of the channel before that outlook strengthens.

 coinpaper.com