u.today
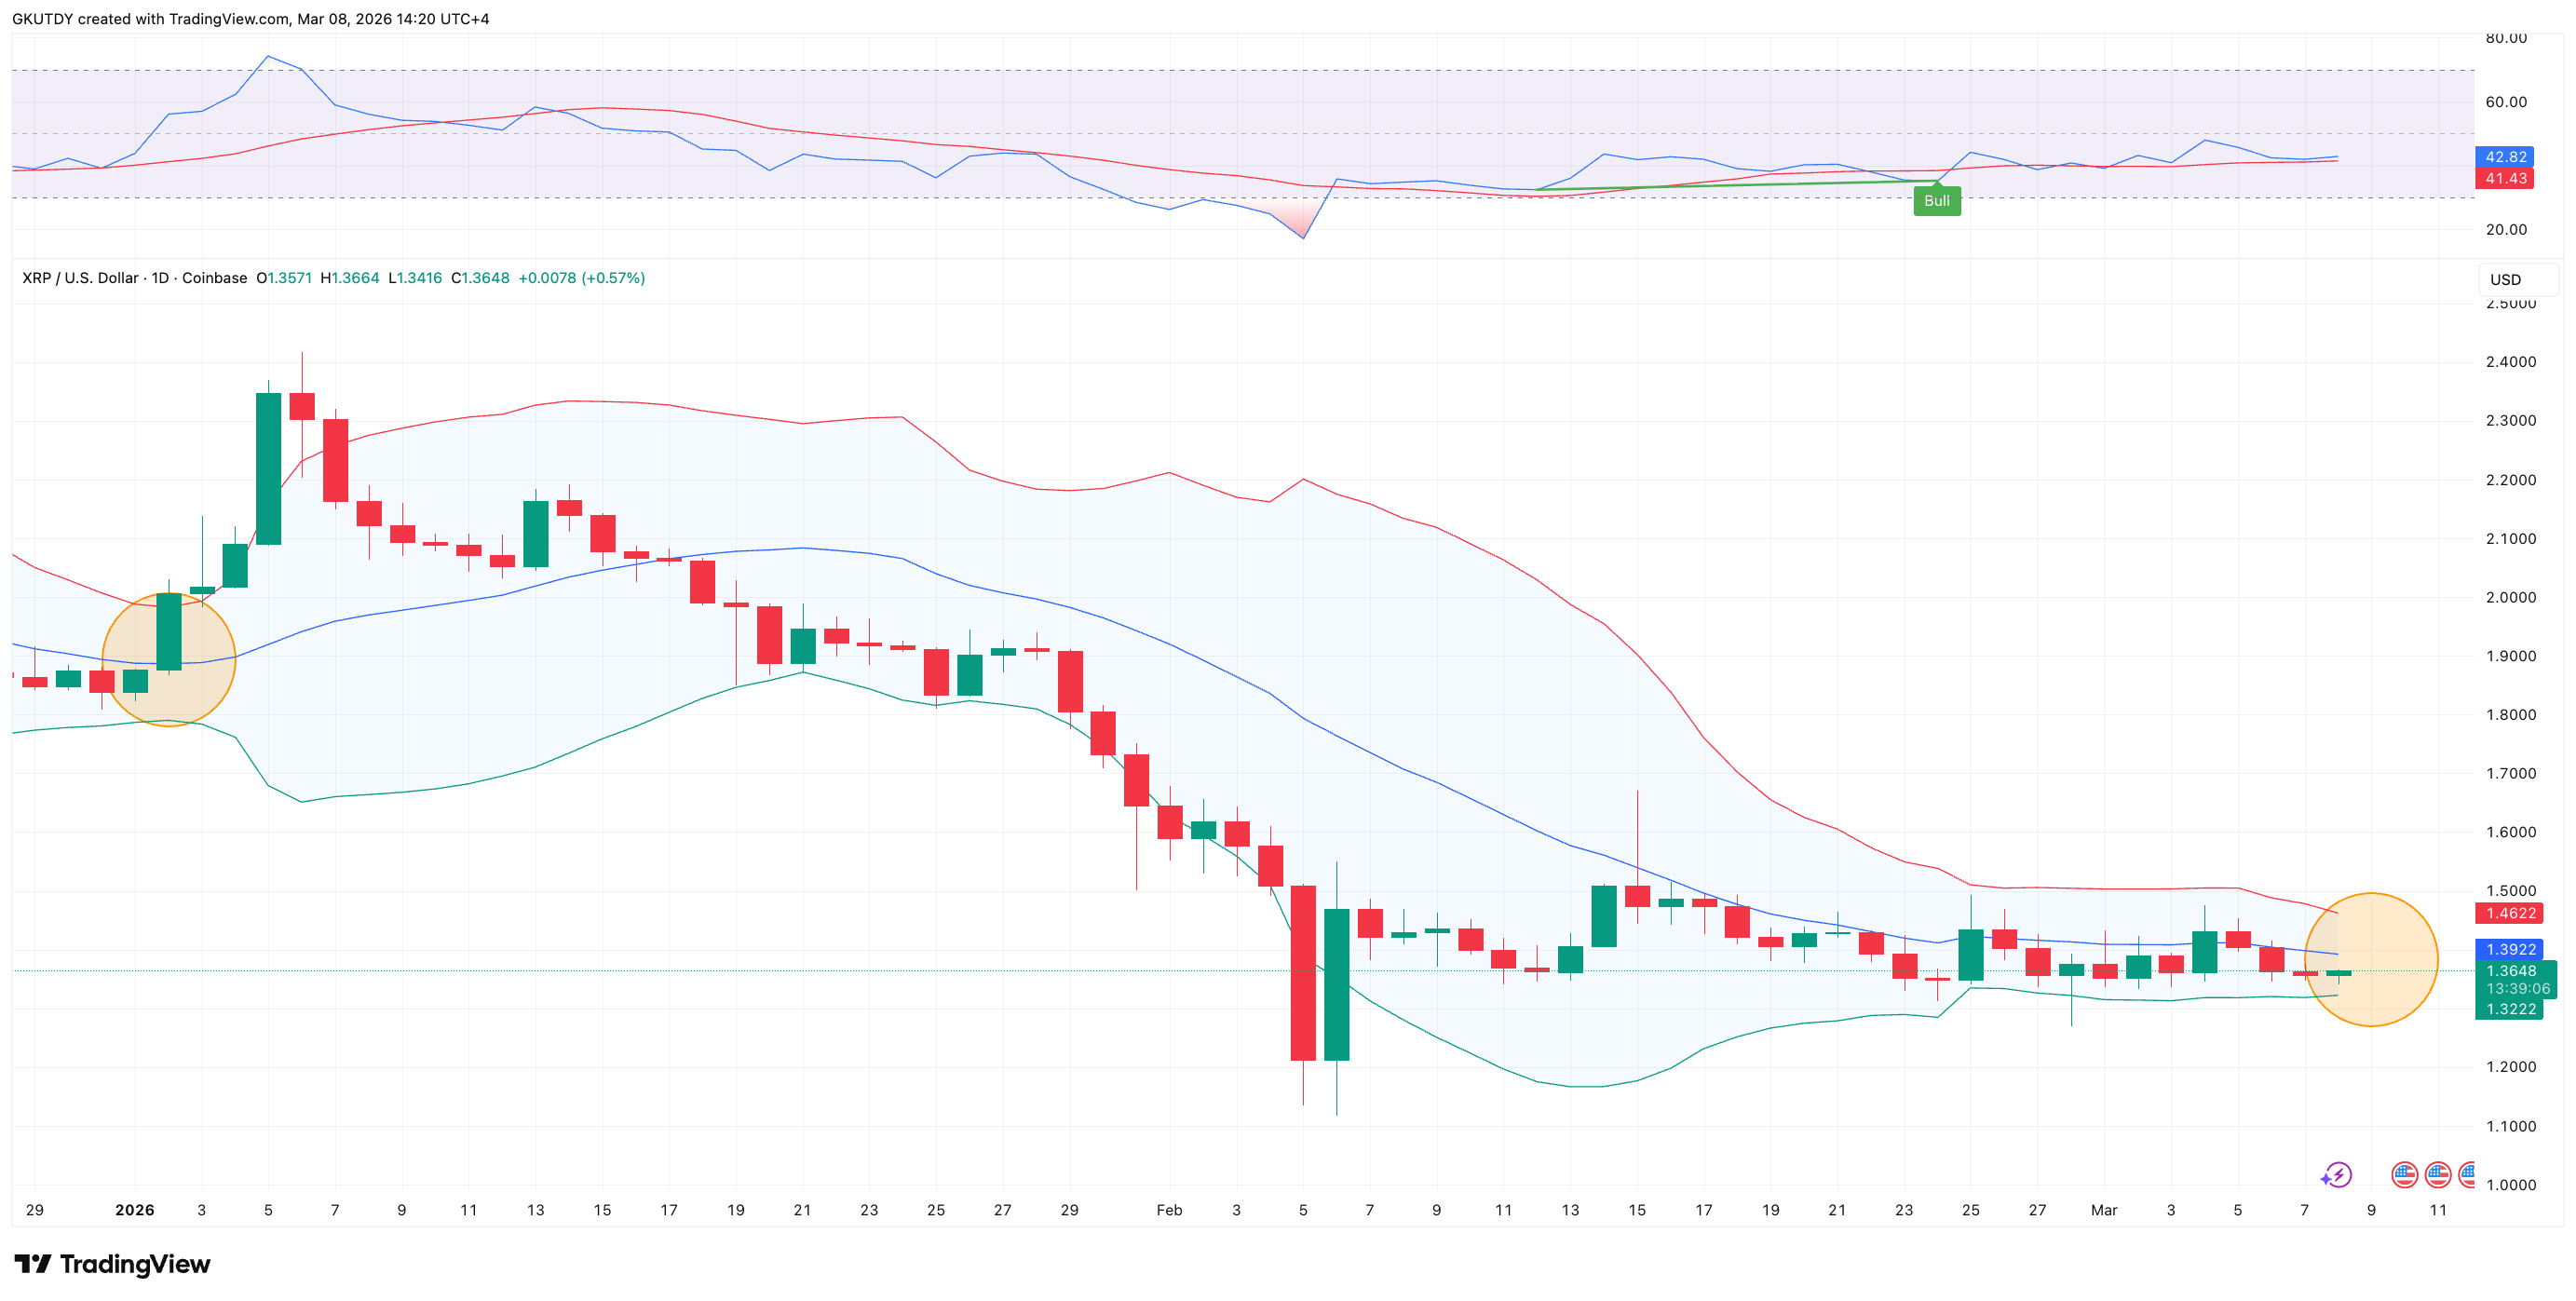
By the end of the first week of March, a classic situation appeared on the $XRP price chart that market participants call a Bollinger Bands squeeze, as presented by TradingView.
Bollinger Bands measure volatility. When the upper and lower boundaries move as close to each other as possible, as seen now on the right side of the chart, it signals extremely low volatility. The logic of the market is that periods of low volatility are always followed by periods of high activity. The more the bands compress, the stronger the following impulse usually becomes.
How CPI and FOMC in March could impact $XRP price
It is visible that the price is trapped in a narrow range, around $1.32-$1.46 per $XRP. This is the classic calm before the storm. A similar compression, for example, led to a rapid increase in the price of $XRP in January this year, when the price rose by more than 25%.