$XRP enters the weekend quoted below $1.45, and the weekly Bollinger Bands are beginning to open up while the price leans against the lower boundary at $1.32, as visible on the TradingView chart. That combination does not guarantee a breakdown, but it does show pressure building at a critical level. Considering that it is a weekly time frame, this kind of structure rarely resolves with a minor move.
$XRP’s bearish grip: Why the 20-week MA remains "unclimbable wall"
The bigger issue is context as the 20-week average, which forms the center of the Bollinger Bands, is sitting near $2 and still pointing lower. Since $XRP topped above $3 in late 2025, every rally has failed beneath that line.
That is what keeps the generally "bearish" structure in play: lower highs, lower closes and no sustained reclamation of trend support at the 20-week MA.
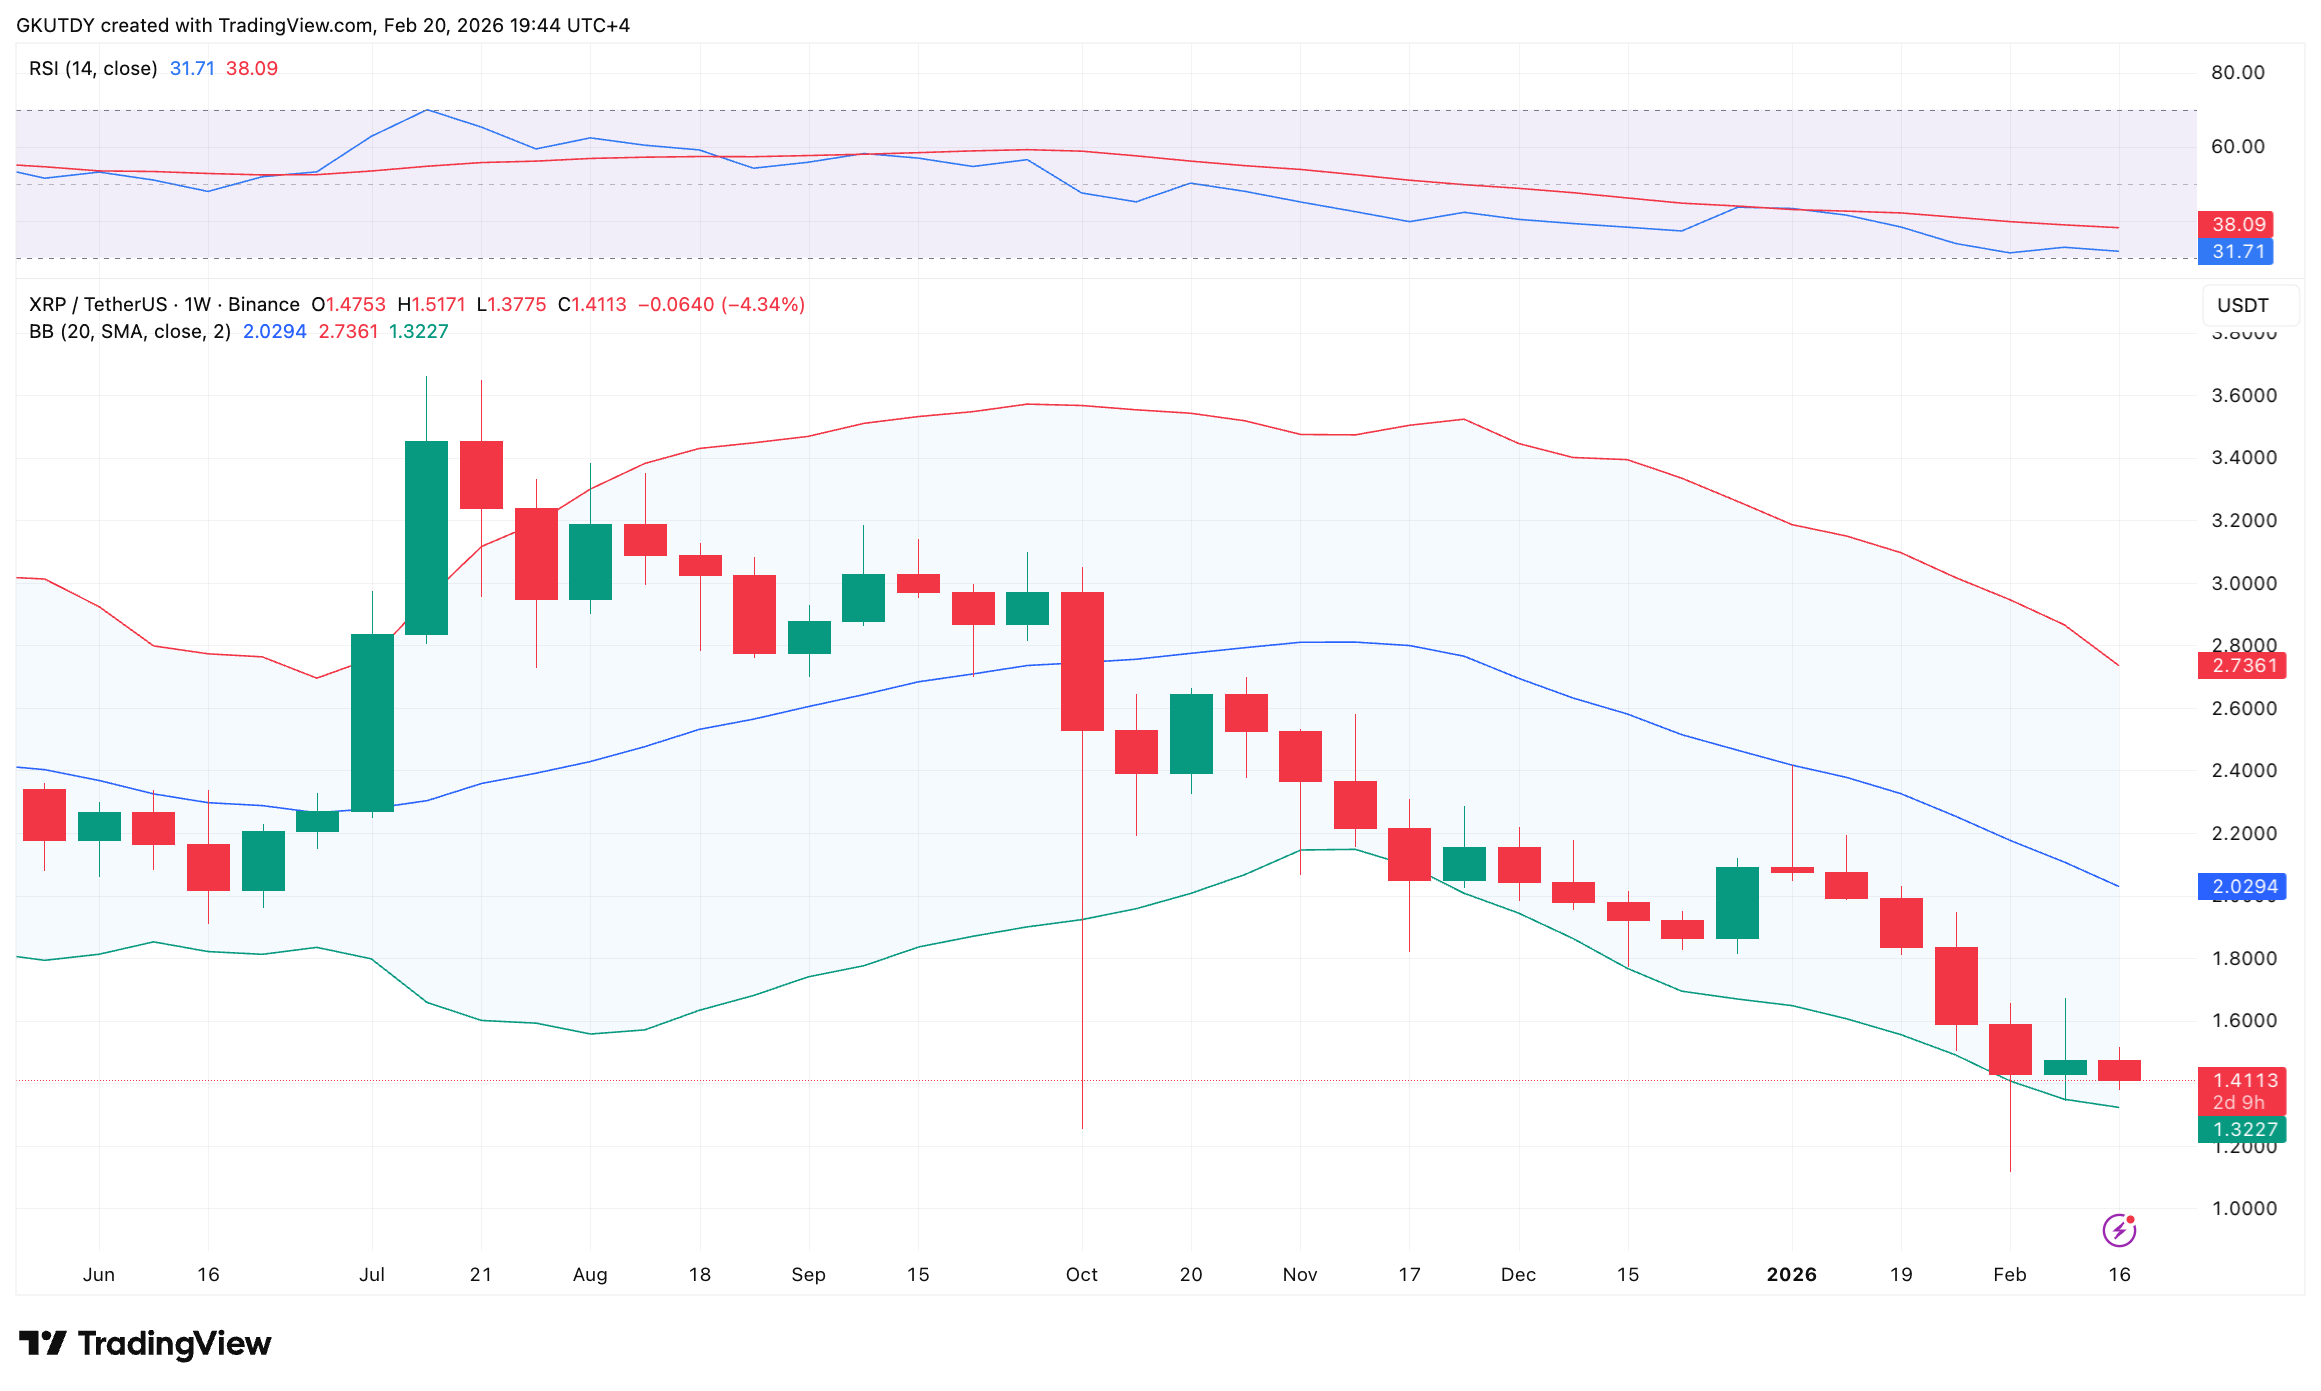
The current setup is even more uncomfortable because of how the price is behaving at the lower band. Instead of bouncing aggressively after tagging it, the $XRP price is printing smaller weekly candles close to the floor around $1.30. That suggests sellers are not exhausted, but the supply is still meeting demand at each attempt to stabilize.
Historically, when $XRP has “walked” the lower band on a weekly chart, the next decisive move has not been small. Either buyers step in with conviction and force a reclaim of the midband, or the market extends lower before any real base forms.
This is where the $1.274 price point, 10% below, comes to light, as it is where the lower Bollinger Band on a daily chart is stretching at the time of writing.