Gold and silver markets are in a sharp correction, with prices falling for a second consecutive session. Commodity-based exchange-traded funds (ETFs) are also declining by as much as 4%.
The sudden downturn has erased an estimated $1.28 trillion in combined market value, reflecting how even traditional safe-haven assets remain vulnerable to macro shocks and liquidity shifts.
Lunar New Year Liquidity and Macro Pressures Fuel Gold and Silver Correction
The decline follows a powerful rally earlier in 2026 that pushed gold above $5,000 per ounce and drove silver to record highs.
Analysts now say the pullback reflects a mix of seasonal factors, macroeconomic pressure, and profit-taking after an extended run-up.
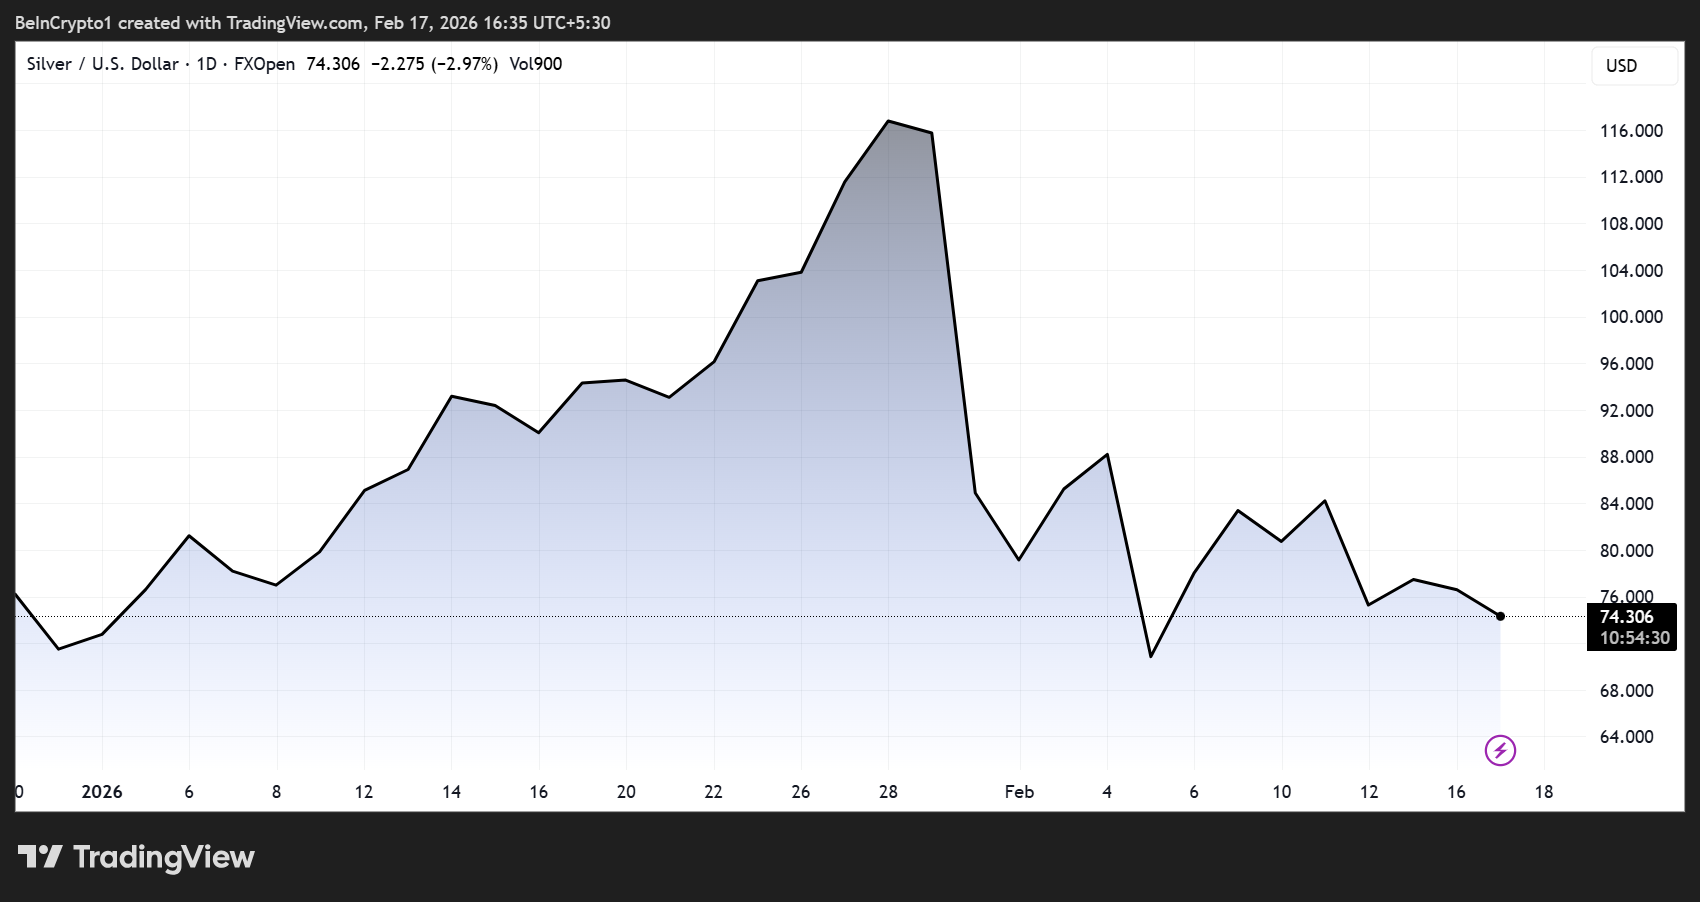
Silver has been hit particularly hard, falling nearly 40% from its all-time high (ATH) of $121.646 recorded in late January.
JUST IN: Silver price down 40% from record high. pic.twitter.com/qz9242ESoz
— Whale Insider (@WhaleInsider) February 17, 2026
As of this writing, Silver (XAG) was trading at $74.11, reinforcing its reputation as a more volatile counterpart to gold, given its smaller market size and stronger industrial demand.
“Gold and Silver wiped out $1.28 trillion today… even ‘safe havens’ bleed,” wrote one analyst, emphasizing the speed of the decline and the risks of assuming stability in any asset class.
Others pointed to the role of market structure and liquidity, arguing that temporary dislocations may occur when key physical markets slow, particularly in Asia.
Lunar New Year Liquidity Effects Come into Focus
Against this backdrop, one of the most widely cited short-term drivers is the Lunar New Year holiday period, during which trading activity across major Asian financial centers declines sharply.
Mainland China, Hong Kong, Singapore, Taiwan, and South Korea all experience reduced participation as traders, manufacturers, and market makers step away.
Lower liquidity can amplify price movements in global futures markets, especially for commodities like silver, where physical demand from the Chinese industry plays a major role.
Weaker demand during the holiday period could temporarily pressure prices, with physical buying potentially resuming once factories and exchanges return to full activity.
I am expecting silver prices to get slammed this week due to the Chinese New Year, meaning the Shanghai exchange isn't functioning. There could be a rare buying opportunity off the dip, as NY and London engage in last-ditch desperate paper shorts. All the shenanigans will…
— HealthRanger (@HealthRanger) February 16, 2026
Analysts Warn of Continued Volatility As Macro Pressures Weigh on Bullion
Beyond seasonal factors, broader macroeconomic developments are also contributing to the downturn. Precious metals came under pressure as investors focused on narratives that strengthen the US dollar in the short term. These include:
- Signals from the US Federal Reserve and
- Geopolitical developments, including US–Iran negotiations
A firmer dollar typically weighs on bullion by making gold and silver more expensive in other currencies, reducing demand from international buyers.
ETF flows reflect the cautious sentiment. Several gold and silver ETFs declined between 2% and 4%. This mirrors weakness in futures markets and suggests that some investors are locking in profits after the recent rally.
Meanwhile, market strategists say precious metals are now in a “volatile consolidation phase.” After such a strong advance, corrections and sideways trading are common as markets digest gains and rebalance positions.
Metals Are Too Hot If Commodities Are a Guide-
— Mike McGlone (@mikemcglone11) February 15, 2026
The stretched metals sector is reminiscent of its July-August 2020 peak vs. broad commodities. A top signal that silver got too hot in January, when it surged above $100 an ounce, was its greatest-ever stretch vs. copper and crude… pic.twitter.com/PkQuBYSc5Z
Therefore, a disciplined approach may be advisable, rather than chasing prices at elevated levels; instead, consider staggered buying during corrections.
Technical analysis also shows key support levels, with estimates placing silver price support near $65 per troy ounce and gold support around $4,770 per ounce on a weekly closing basis.
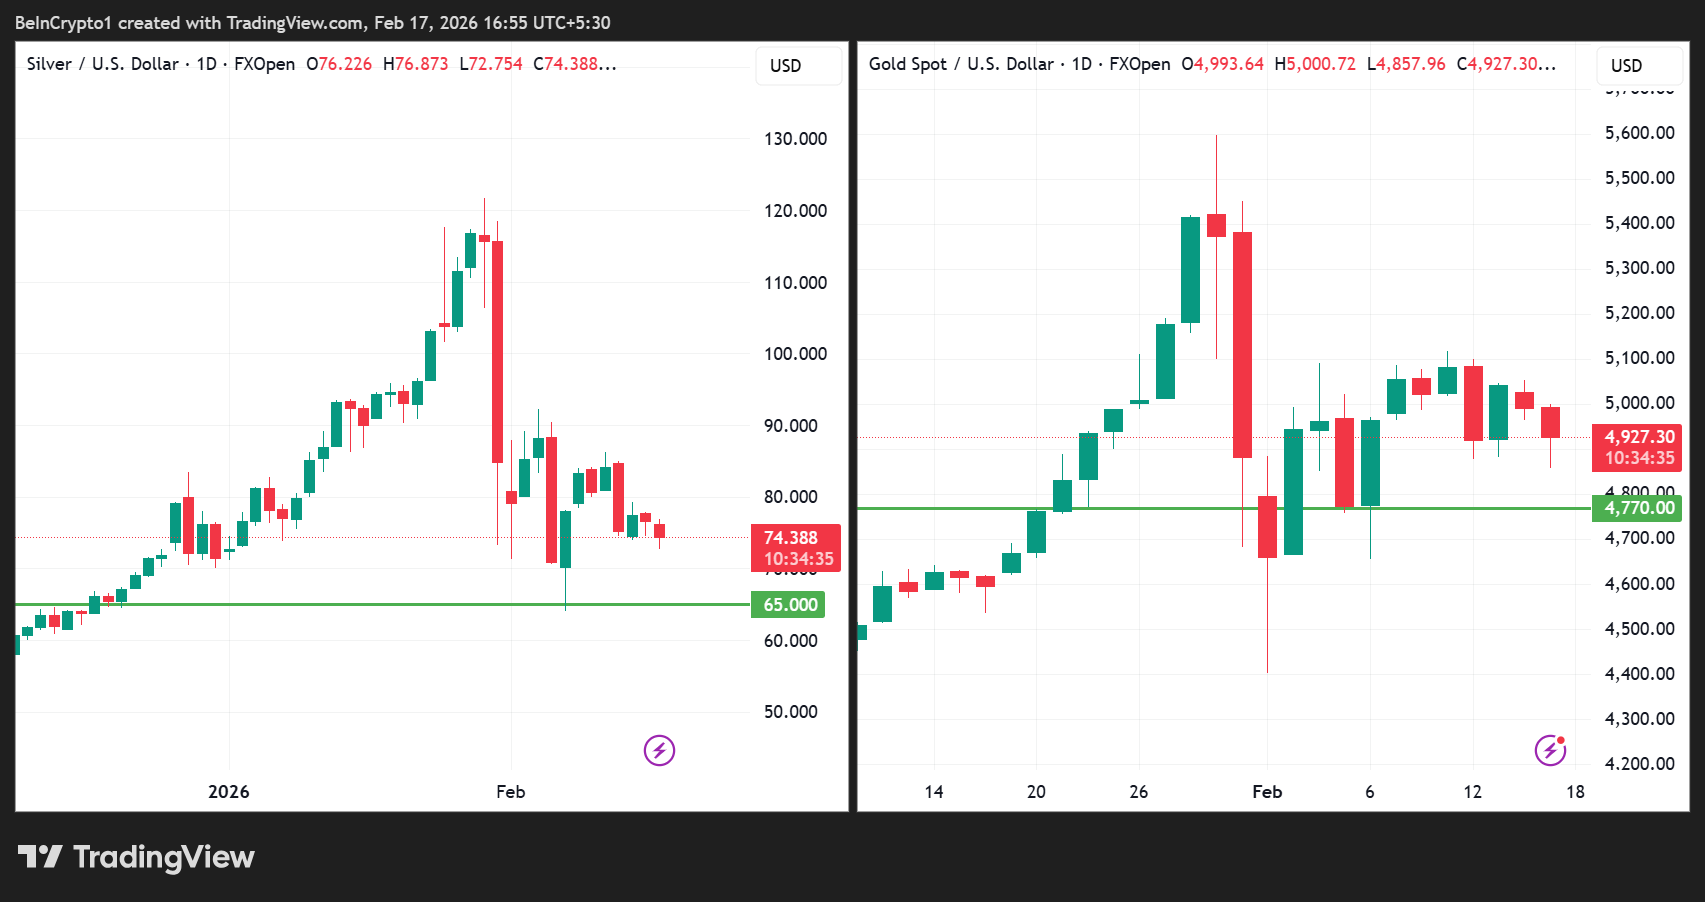
While these levels could determine whether the current pullback stabilizes or deepens, investors should conduct their own research.
Despite the sharp drop, structural forces such as rising global debt, currency debasement, and historical cycles in ratios, such as the gold–silver ratio, could support a powerful long-term bull market in precious metals.
BREAKING: US national debt is set to surge +$2.4 trillion PER YEAR over the next 10 years, according to new CBO estimates.
— The Kobeissi Letter (@KobeissiLetter) February 16, 2026
As a result, US debt will likely reach a record $64 TRILLION in 2036, doubling from 2023 levels.
That would be TRIPLE the debt recorded in 2018, before the… pic.twitter.com/cYnyht45ec
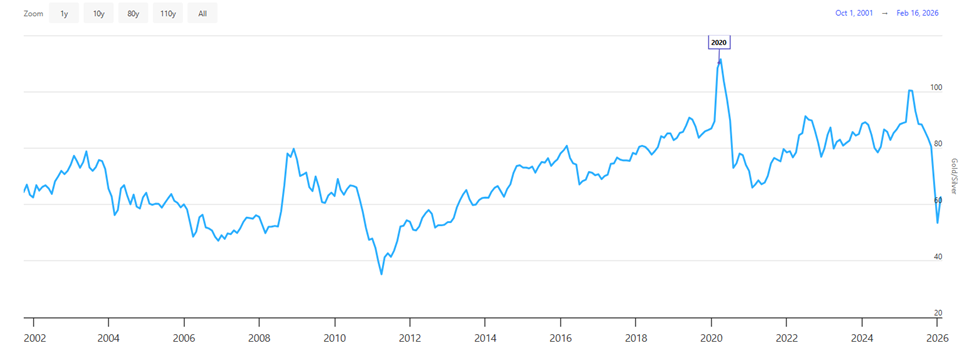
If historical ratio reversals repeat, silver could experience significant upside over the coming decade, potentially reaching dramatically higher price levels by the early 2030s.
The post $1.28 Trillion Wiped Out as Gold & Silver Crash—Is Lunar New Year Liquidity Driving the Drop? appeared first on BeInCrypto.