u.today
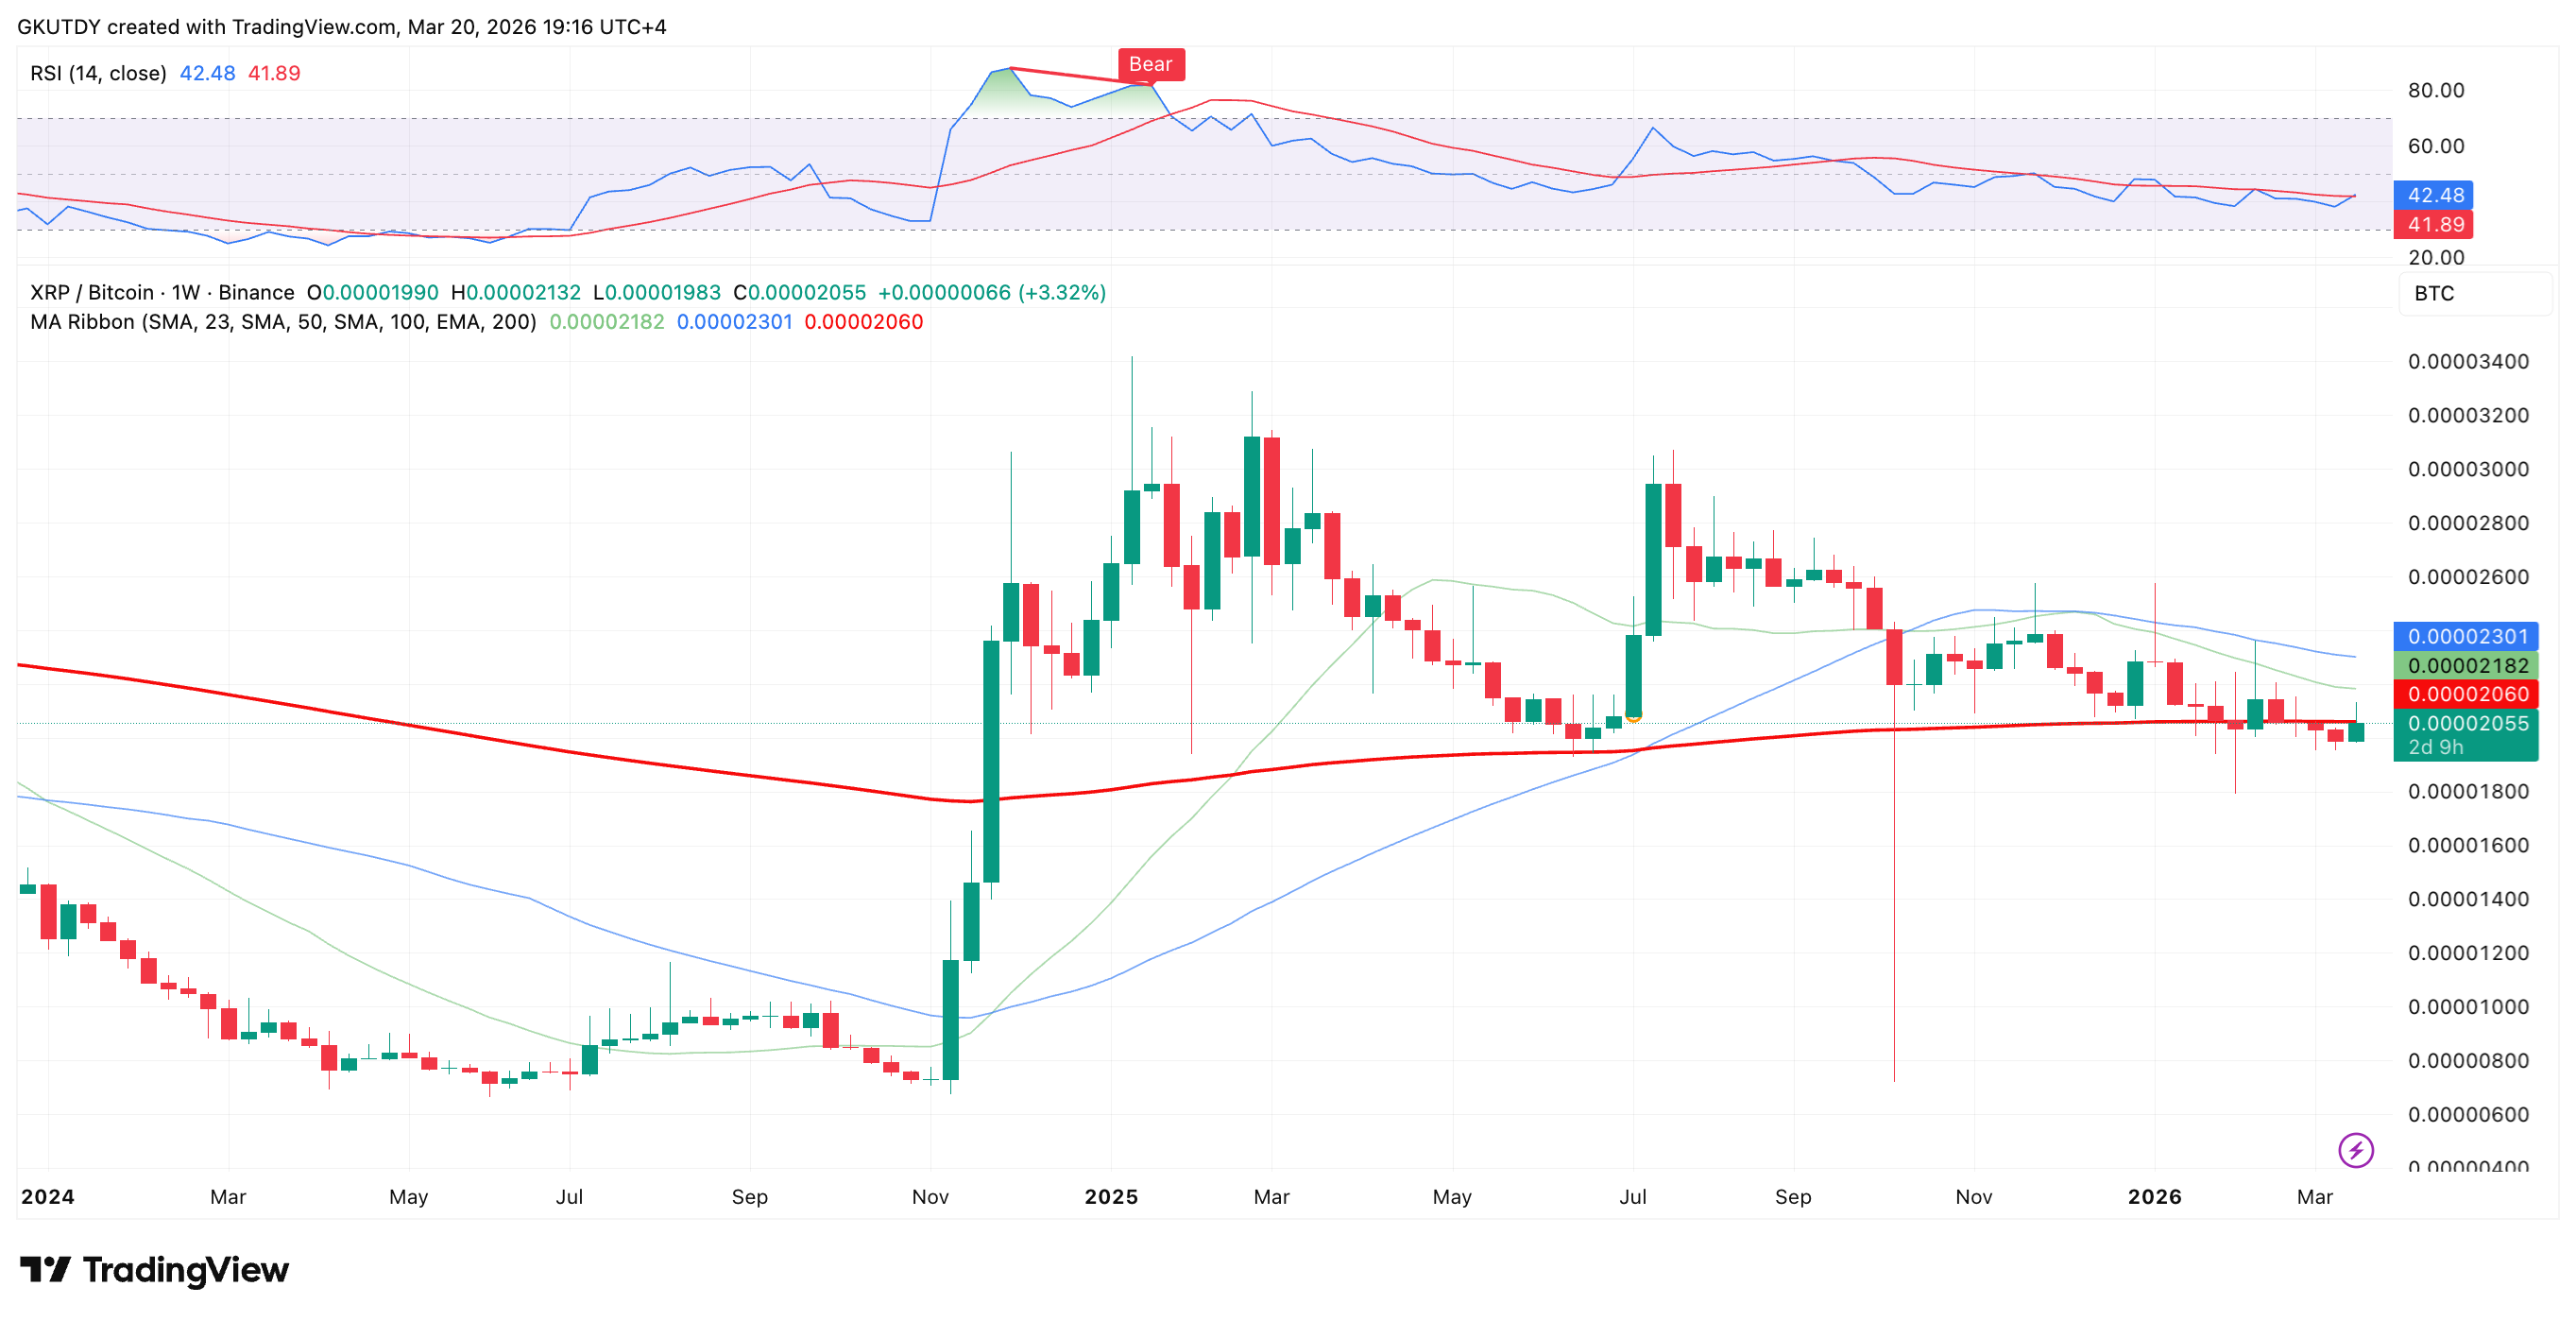
The situation on the $XRP-versus-Bitcoin chart looks like a "make or break" one for altcoin supporters. As of the end of the week, the pair is sitting in a critical zone that may determine the trend for the coming month.
What is visible on the TradingView chart is not just a retest of the 200-week moving average but an attempt by $XRP to hold above it. In technical analysis, a weekly close below this level often signals a transition into a prolonged bearish cycle.
Why failed 200-day MA retest this Monday could trigger 64% decline
At the moment, $XRP is valued at 0.0000206 $BTC. There are two days left until the weekly close, and if the price fails to consolidate above the red line, the technical breakdown-retest scenario will be confirmed.