Silver faces mounting downside risk as extreme valuation signals flash warnings, with intermetal comparisons suggesting prices remain stretched and vulnerable to a sharp reversion even after a significant pullback.
Silver Bears Warn of Painful Reversion — Silver’s Price Strength Masks Growing Downside Risk
Bloomberg Intelligence senior commodity strategist Mike McGlone shared on social media platform X on Jan. 31 a bleak outlook for silver, warning that extreme valuation signals point to meaningful downside risk and positioning the metal as vulnerable to a sharp and potentially painful reversion.
“Copper can direct silver’s silliness back toward $60,” McGlone began, framing silver’s trajectory through relative valuation rather than outright price direction, arguing that intermetal comparisons provide clearer signals than nominal levels alone. He added:
“If silver drops to $60 an ounce and copper is relatively unchanged, the former could still be the most expensive ever vs. the latter.”
The strategist emphasized that the chart accompanying his post illustrates how elevated the silver-to-copper ratio remains despite recent volatility, underscoring that a sharp decline would not necessarily equate to fair value when benchmarked against copper’s steadier pricing profile.
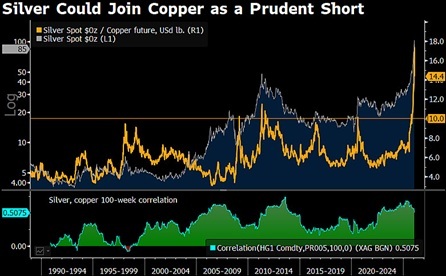
The chart shows the ratio recently hovering well above historical peak territory, even after easing from extremes that approached nearly 19 pounds of copper per ounce of silver earlier in the year. A highlighted reference level near 10 contrasts with a current reading still in the mid-teens, reinforcing the view that silver remains stretched on a long-term logarithmic scale spanning multiple commodity cycles. Additional chart data points to a 100-week silver-copper correlation of about 0.51, signaling a meaningful relationship that can widen during speculative phases rather than move in lockstep.
Silver already suffered a historic and violent collapse on Jan. 30, plummeting over 31% in a single session—its worst daily performance since 1980. The fall was triggered by President Donald Trump’s nomination of Kevin Warsh as Fed Chair, which sent the U.S. dollar and Treasury yields surging while sparking a massive liquidity wipeout of overleveraged positions. Prices that had peaked above $120 just 24 hours prior crashed toward $84, eventually stabilizing near the $78-$80 range as forced liquidations and a 36% hike in CME margin requirements crushed the parabolic rally.
Read more: COMEX Silver Inventories Drain Rapidly as Short Squeeze Goes Full Swing
The strategist further explained:
“Since 1988, roughly 10 has marked peaks in the silver/copper ratio, with an average of six. Silver above $100 an ounce may be joining a prudent-short category with copper.”
McGlone’s projection suggests that copper’s role as a globally consumed industrial metal, tied to manufacturing, infrastructure, and electrification demand, may act as a stabilizing anchor for relative valuation. Under that framework, silver’s investment-driven volatility, amplified by momentum and monetary expectations, leaves it vulnerable to further adjustment. Even a retreat toward $60 would represent normalization rather than capitulation, with relative pricing still elevated versus copper. The analysis positions silver’s recent strength less as a durable re-rating and more as an excess that could unwind as historical ratios reassert themselves.
FAQ ⏰
-
Why does the silver-copper ratio matter for silver prices?
It highlights relative valuation extremes that can signal when silver is historically overextended versus copper. -
What downside risk did Mike McGlone highlight for silver?
He warned silver could fall toward $60 an ounce and still remain expensive relative to copper. -
How elevated is the current silver-copper ratio?
The ratio remains in the mid-teens, well above the long-term average and historical peak levels. -
Why is copper used as a benchmark against silver?
Copper’s industrial demand provides a steadier pricing anchor compared with silver’s investment-driven volatility.