XRP faces potential resistance around the Ichimoku Cloud as it consolidates within a symmetrical triangle, setting up for a possible breakout.
Currently, XRP changes hands at $2.07, reflecting a 0.8% increase over the last 24 hours. The crypto has shown some volatility within the 24-hour range, oscillating between $2.05 and $2.17, signaling market activity and potential support and resistance levels in this range.
In terms of recent performance, XRP has lost 5.0% over the past 7 days, reflecting negative momentum in the longer timeframes. Further, in the last 14 days, it has experienced a 4.8% decline. Longer-term trends show an 18.3% drop over the past month, suggesting that the overall market sentiment for XRP has been somewhat negative in the longer term.
Despite recent volatility and mixed performance metrics, XRP’s recent uptick in the last 24 hours has sparked renewed interest. Where is XRP headed?
XRP Price Analysis
XRP’s 4-hour chart shows the crypto asset’s price currently situated near key resistance levels. The Ichimoku Cloud indicates that XRP is trading just above the cloud’s support level.
Further, the red base line at $2.09 acts as the immediate resistance, while the blue conversion line is higher at $2.11, indicating a second possible resistance level if the price moves higher. Additionally, the cloud itself is creating a potential area of resistance above $2.10.
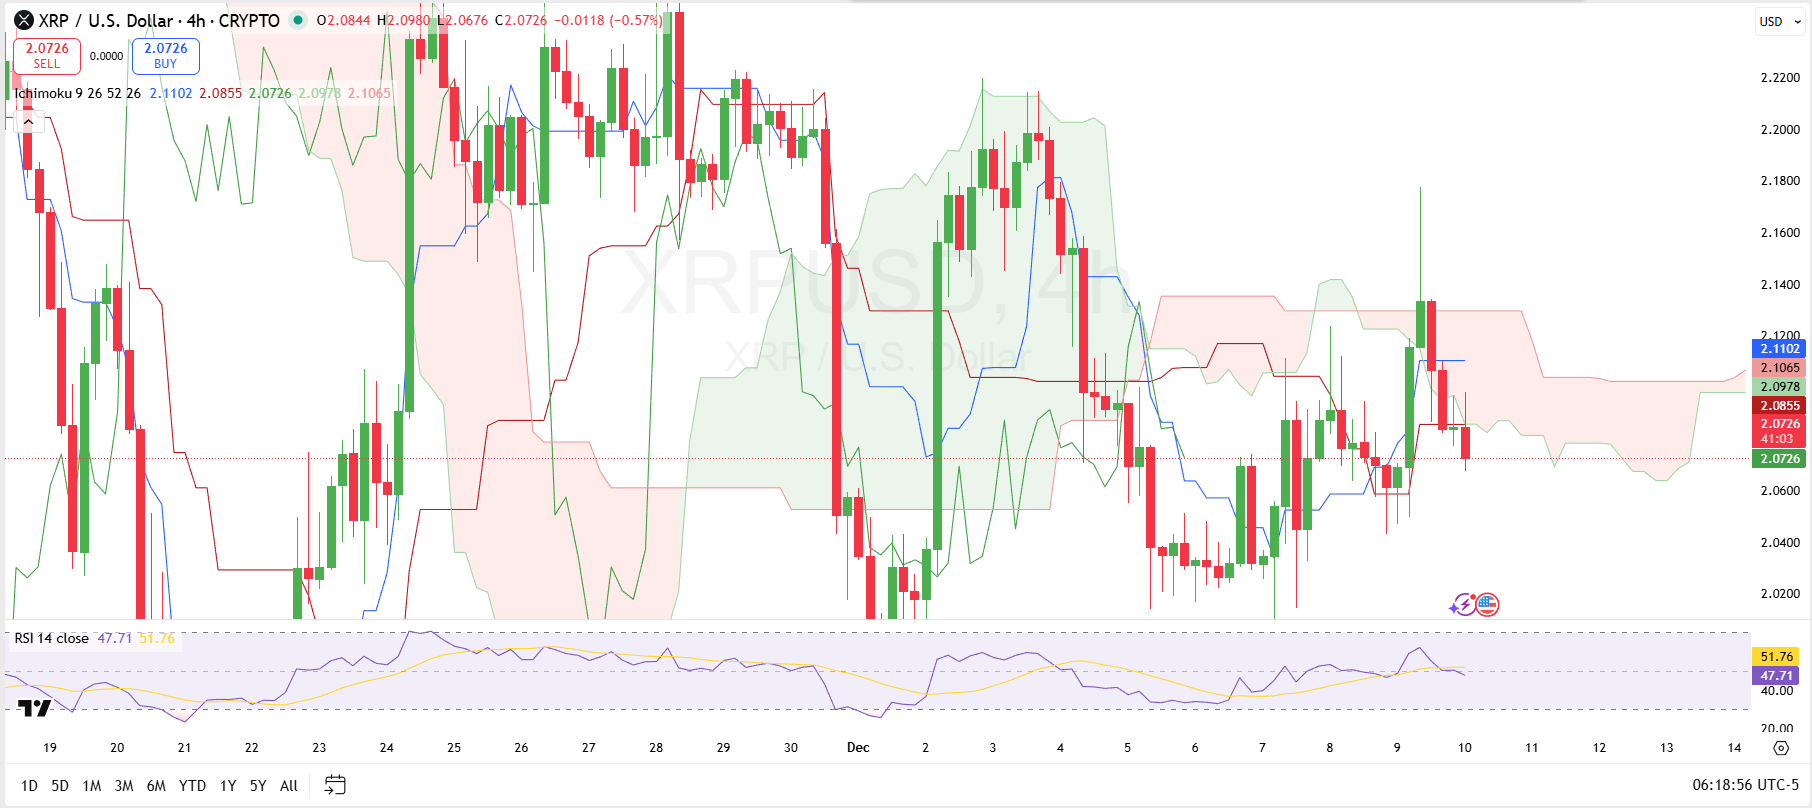
Looking at support levels, XRP found some buying interest yesterday near $2.04, with the lower bound of the Ichimoku Cloud providing immediate support around $2.06. If the price dips below the cloud and breaks this level, there is a chance that XRP will test further support near $2.02.
The Relative Strength Index (RSI) currently sits at 47.71, suggesting a neutral towards slightly bearish market sentiment, as the price is neither in overbought nor oversold territory. The RSI’s direction could provide further insight into whether XRP will maintain momentum or face a deeper retracement.
Potential 16% XRP Upside
On the commentary side, XRP is currently trading within a symmetrical triangle pattern as highlighted by analyst Ali Martinez. The price has been consolidating between the upper and lower trendlines, indicating a period of indecision.
This consolidation is typically a precursor to a breakout, and given the structure, XRP could experience a sharp move once the price breaks out of the triangle.

Per Martinez, a breakout to the upside could see XRP rise by as much as 16%, reaching potential resistance levels. For perspective, a 16% run from the current $2.07 level would take XRP to approximately $2.40.