
$XRP’s price has been showing signs of consolidation in recent days and oscillating between $2.30 and $2.50. The entire crypto market has been relatively steady, and $XRP has managed to maintain its footing above $2.20.
Despite the slow momentum, a technical analysis shared by the crypto analyst known as ChartNerd on X suggests that $XRP could be preparing for a massive breakout that could take it from current levels toward a long-term target above $27. The analysis is supported by a chart showing multiple confluences aligning in favor of such a large-scale move.
$XRP Technical Analysis Points To Rally
According to ChartNerd’s chart, $XRP has now completed a symmetrical triangle breakout pattern that has been forming for several years. This breakout is occurring above a multi-year ascending support line that dates back to 2017. The chart also shows an important resistance block that previously capped $XRP’s price during earlier bull runs in 2017 and 2021.
$XRP broke above this resistance block months ago, but recently retested it during last week’s flash crash. Its rebound from this resistance block reinforces the idea that $XRP is about to bounce massively. The breakout from this long-term consolidation zone, combined with the multi-year ascending trendline, provides the technical foundation for a potential move toward much higher price targets.
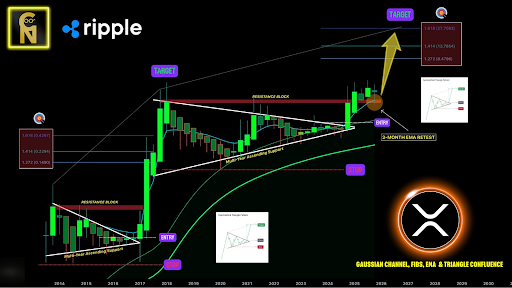
Another important confirmation that occurred during the flash crash was the successful retest of the 3-month 10 EMA. This retest serves as a validation point for the recent breakout, showing that $XRP is maintaining its structure on higher timeframes. Furthermore, the analysis shows that $XRP has reclaimed the Gaussian Channel upper regression line, which represents long-term trend momentum.
This alignment of the EMA retest with the Gaussian Channel suggests strong bullish momentum is beginning to build. ChartNerd refers to this convergence of multiple indicators as a “confluence zone.”
Fibonacci Extension Targets From $8 To $27
The analysis concludes with a clearly defined Fibonacci extension roadmap that outlines $XRP’s next price objectives. ChartNerd’s Fibonacci levels place the first major target at $8.47, corresponding to the 1.272 extension, followed by $13.78 at the 1.414 level, and finally the 1.618 extension at $27.70.
This sequence implies a full technical replication of $XRP’s bull run in 2017, scaled to its current breakout structure. Back then, $XRP hit all three Fibonacci extensions from the previous low after breaking above a similar resistance block.
If these projections materialize, $XRP could experience its most significant rally in years. The move toward $27 could unfold in one of two ways: either through a strong, near-vertical surge similar to the explosive rally of 2017 or through a series of measured advances highlighted by corrections at each resistance level. Nonetheless, both scenarios have the same bullish structure.
At the time of writing, $XRP is trading at $2.44, up by 1.4% in the past 24 hours.