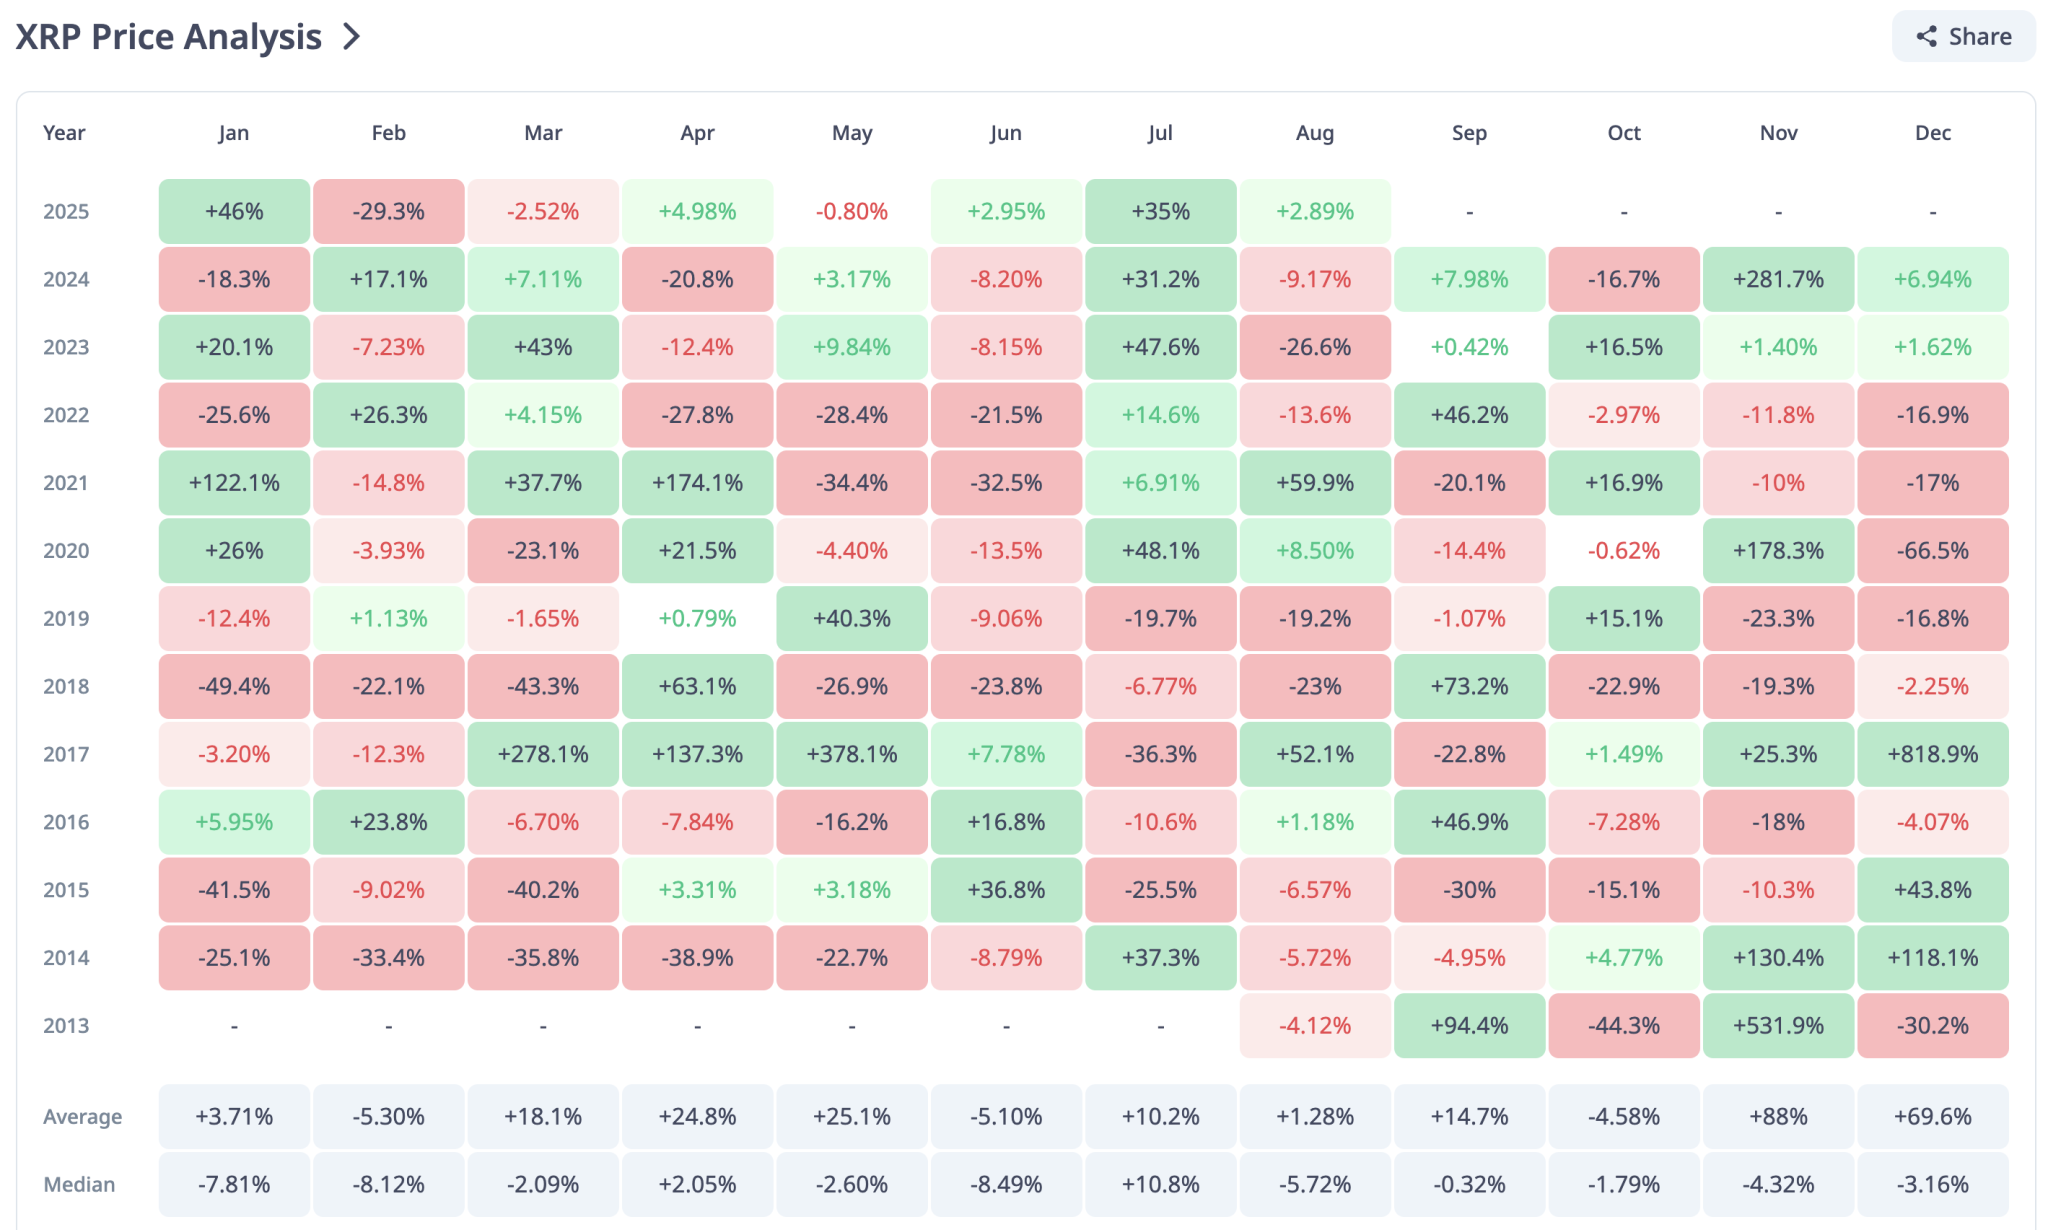
Here’s how $XRP price has historically performed in August over the past 12 years, and let’s try to predict $XRP’s outlook for the coming days.
After a bearish start to the month, the market has turned around significantly in just two weeks. Specifically, Bitcoin has established a new all-time high at $124,400, and Ethereum is on track to do the same, potentially breaking into the $5,000 range.
The broader altcoin market is also gradually booming, and all eyes are on $XRP to see how it will perform. Notably, $XRP briefly touched $3.35 before settling at $3.12 at press time.
$XRP had an even worse performance in August 2023. It opened the month at $0.6985 and closed at $0.5108, marking a significant 26.6% loss. This was the worst August performance in $XRP’s history.
Notably, in the previous month, $XRP had traded as high as $0.94 on the back of its lawsuit victory, but it quickly gave up those gains.
$XRP also posted losses in:
- August 2022: down 13.6%
- August 2019: down 19.7%
- August 2018: down 23%
- August 2015, 2014, and 2013: down 6.57%, 5.72%, and 4.12% respectively
On the other hand, $XRP reported notable August gains in:
- 2021: +59.9%
- 2020: +8.5%
- 2017: +52.1%
- 2016: +1.18%
In total, over the past 12 years, $XRP has posted losses in August eight times and gains only four times. If the current trend holds, this August may become the fifth time $XRP ends the month in the green.
Historically, $XRP’s average performance in August is a modest +1.25% gain, with a median performance of -5.72%. This suggests that August is typically not a favorable month for $XRP. If $XRP observes the +1.25% average gain this August, it will close the month at $3.0577. Meanwhile, if it witnesses the -5.72% drop, its price will slump to $2.85.
$XRP in September and July
Also, $XRP’s performance in September hasn’t been much better. Since 2013, it has posted an equal number of bullish and bearish returns in September. The average return stands at +14.7%, but the median return is -0.32%.
Conversely, July has historically been a bullish month for $XRP, recording gains in seven out of twelve years. The average return for July is +10.2%, and the median return is +10.8%, making it one of $XRP’s stronger months.
$XRP’s Most Promising Months
Meanwhile, the most promising months for $XRP Price have been November and December.
In November 2013 and 2014, $XRP posted massive returns of +130% and +531%, respectively. Similar surges occurred in November 2020 and 2024, with gains of +178% and +281%.
In December, $XRP saw a 118% gain in 2014, and an extraordinary 819% gain in 2017. Other months that have shown occasional strong performances include March and April.
While $XRP’s historical performance in August and September may not appear promising, some analysts believe this time could be different. One analyst even suggested that $XRP could overtake Ethereum by September.