Data from CoinMarketCap highlights the ongoing turbulence in SHIB’s price action, reflecting increased volatility over the past few weeks. At the time of writing, the cryptocurrency traded at $0.00002126, reflecting a 6% drop over the last seven days and a slight 0.56% decline from its previous day’s value.
The downturn has impacted its market cap, now at $12.49 billion, alongside a reduced 24-hour trading volume of $557.59 million. With a volume-to-market cap ratio of 4.44%, market sentiment remains relatively stable.
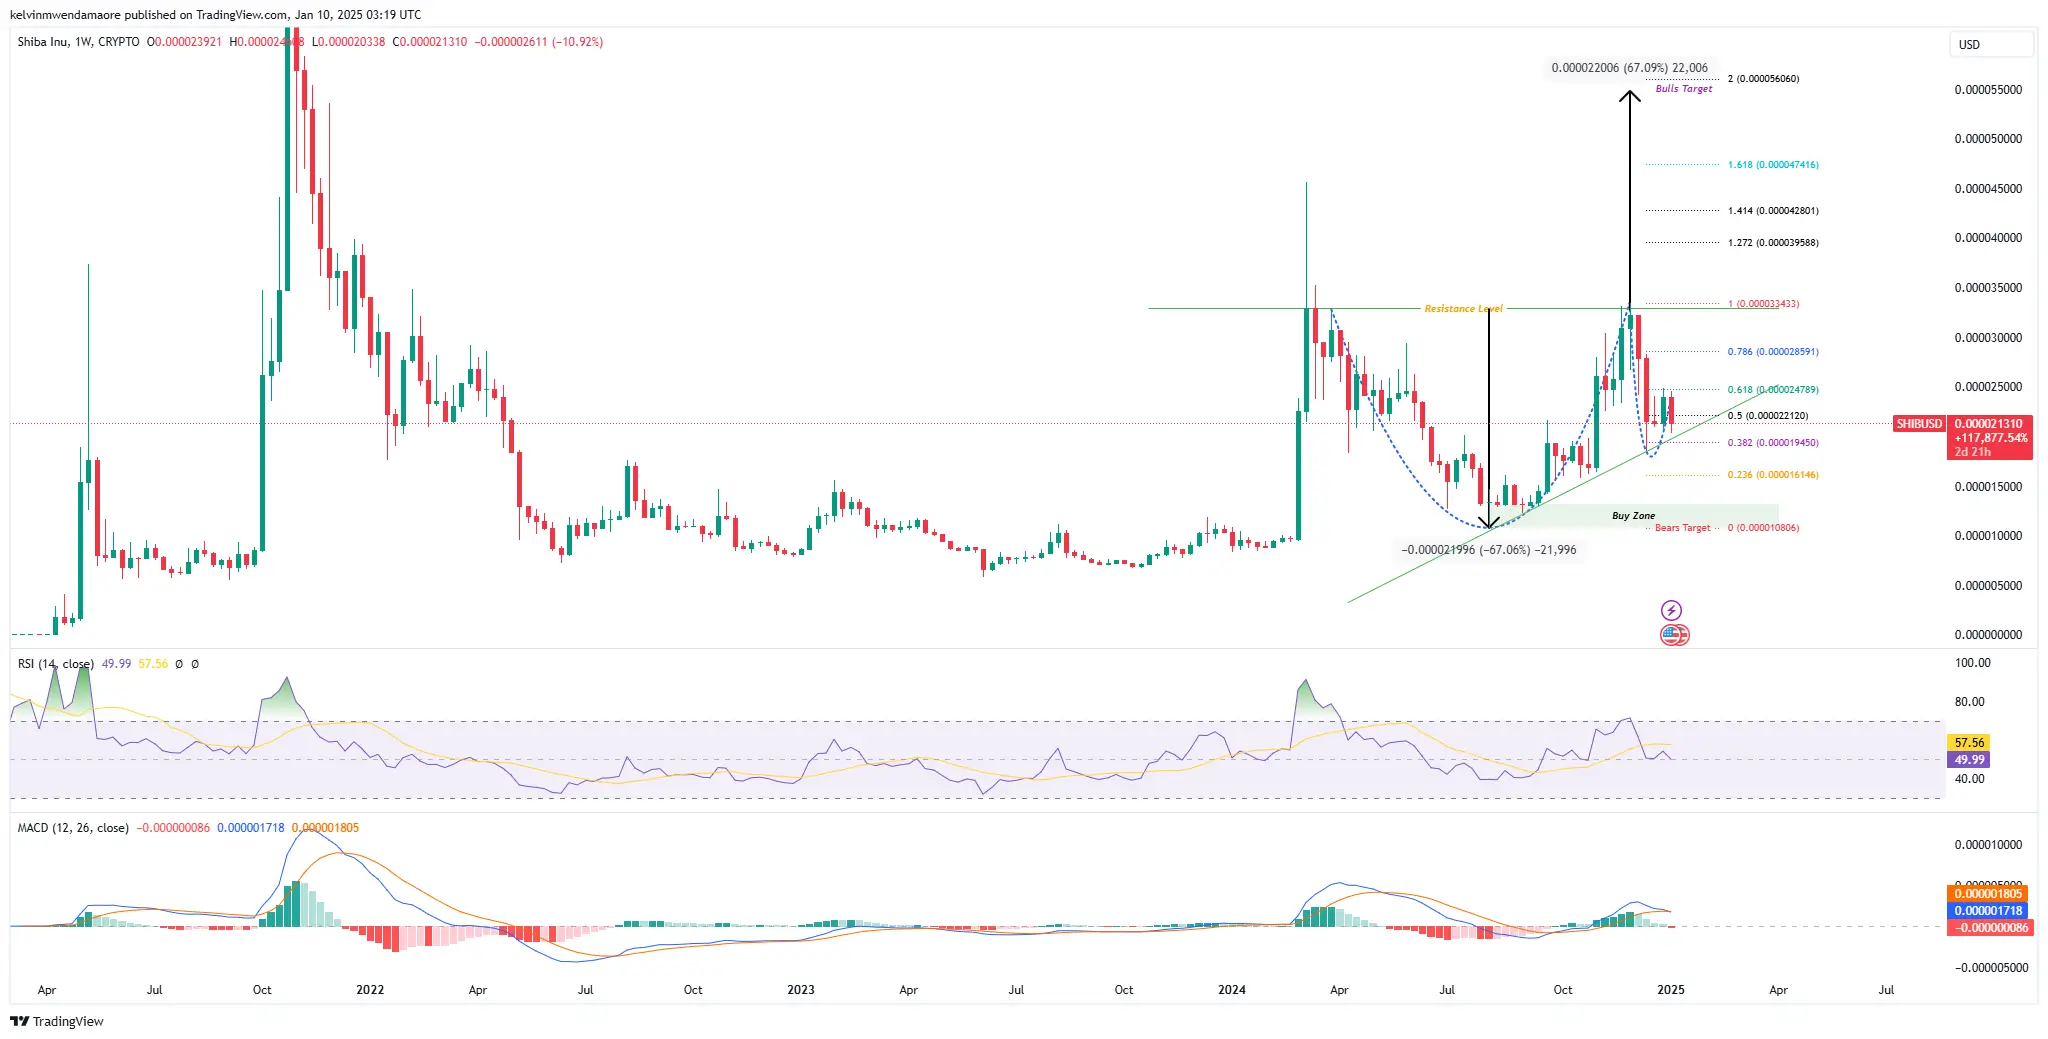
Yet, amidst this bearish momentum, Shiba Inu’s weekly chart tells a different story that hints at a possible rebound. Intriguingly, the chart reveals the emergence of bullish formations, including an ascending triangle and a cup-and-handle pattern, often precursors to upward price movements. Could these patterns signal the calm before a surge?
SHIB’s Bullish Prospects: Patterns to Watch
The first is the ascending triangle, a classic pattern defined by a horizontal resistance line and an ascending support trend. This structure reflects increasing bullish momentum as buyers drive the token toward higher lows. At present, Shiba Inu hovers near the lower boundary of the triangle, a critical support zone where buyers may step in to defend the price.
Should the token break above this formation, it could spark a rally toward $0.000040, aligning with the 1.272 Fibonacci extension. A more extended move might even target the $0.000047 level, coinciding with the 1.618 Fib extension, setting the stage for a huge breakout. Another key pattern emerging on the weekly chart is the cup and handle, a structure known for signaling impending bullish momentum.

The “cup” forms a rounded base, while the “handle” represents a consolidation period before an upward breakout. Currently, the SHIB cryptocurrency is consolidating within the handle phase, suggesting the token is building energy for its next move. If a breakout materializes, SHIB’s price could soar by over 67%, reaching the $0.000056 zone, aligning with the 2.0 Fibonacci extension. However, for this scenario to unfold, the price must first reclaim the $0.000032 level to complete the handle pattern.
On the flip side, sustained bearish sentiment could push SHIB below the ascending triangle’s support, targeting $0.000016 as a likely safety net. A breach below this zone might see the price descend further to the $0.000013-$0.000010 range, an accumulation zone where buyers could step in, setting the stage for a possible recovery.
Technical Indicators Signal Consolidation
SHIB’s technical indicators reinforce the current consolidation narrative. For instance, the Relative Strength Index hovers at 49.99, a near-neutral stance indicating neither overbought nor oversold conditions. While this suggests a balanced market, the RSI’s recent descent from overbought levels hints at bearish undertones as sellers attempt to seize control.
Meanwhile, the Moving Average Convergence Divergence paints a more nuanced picture. The MACD line at 0.000001718 sits just below the signal line at 0.000001805, indicating weakening bullish momentum. The diminishing histogram underscores this, reflecting a market awaiting a decisive move as it stabilizes around the zero line.
 cryptonewsz.com