XRP is currently trading at $2.37, having declined by 3.7% in the last 24 hours. Its market capitalization stands at $136 billion, with a daily trading volume of $4.58 billion. The price fluctuated between $2.34 and $2.46 over the past day, and it remains 30.1% below its all-time high of $3.40 per coin, set on Jan. 7, 2018.
XRP
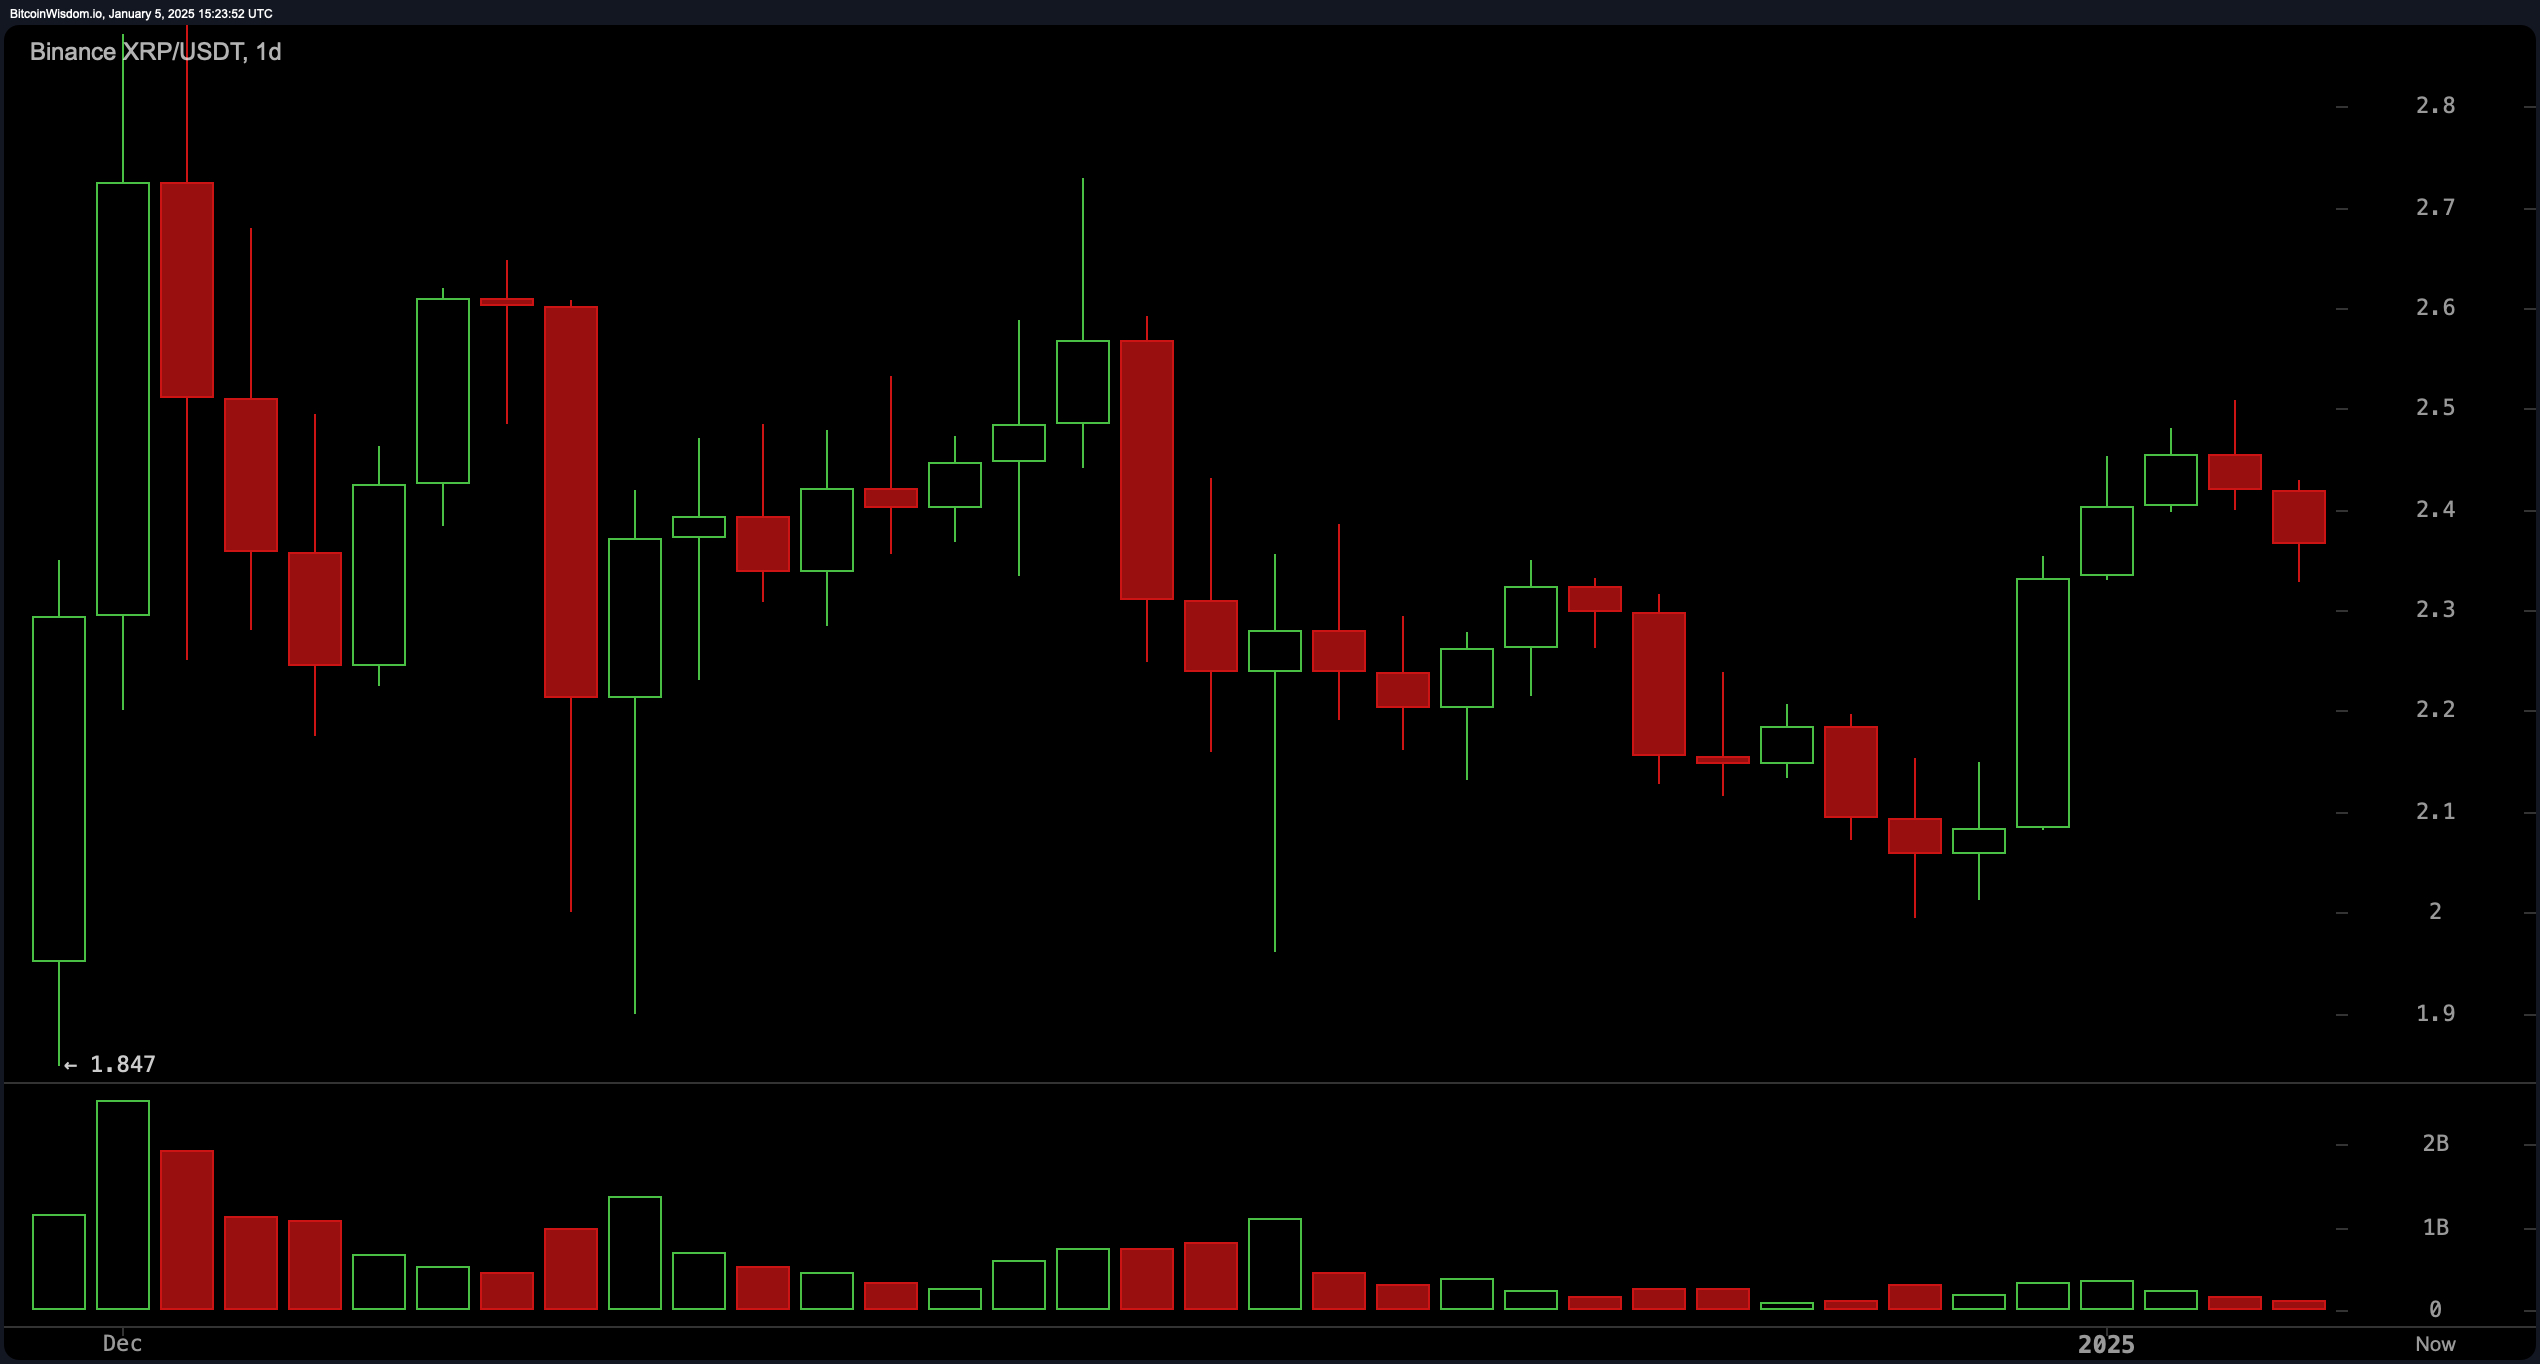
XRP’s daily chart reveals a period of stabilization after a recent upward trend that lifted the price from $2.00 to $2.50. Key support levels are noted at $2.20 and $2.00, while resistance persists at $2.50 and $2.65. Indicators like the moving average convergence divergence (MACD) and momentum (10) hint at sustained optimism, bolstered by encouraging buy signals from both exponential moving averages (EMAs) and simple moving averages (SMAs) across various timeframes.

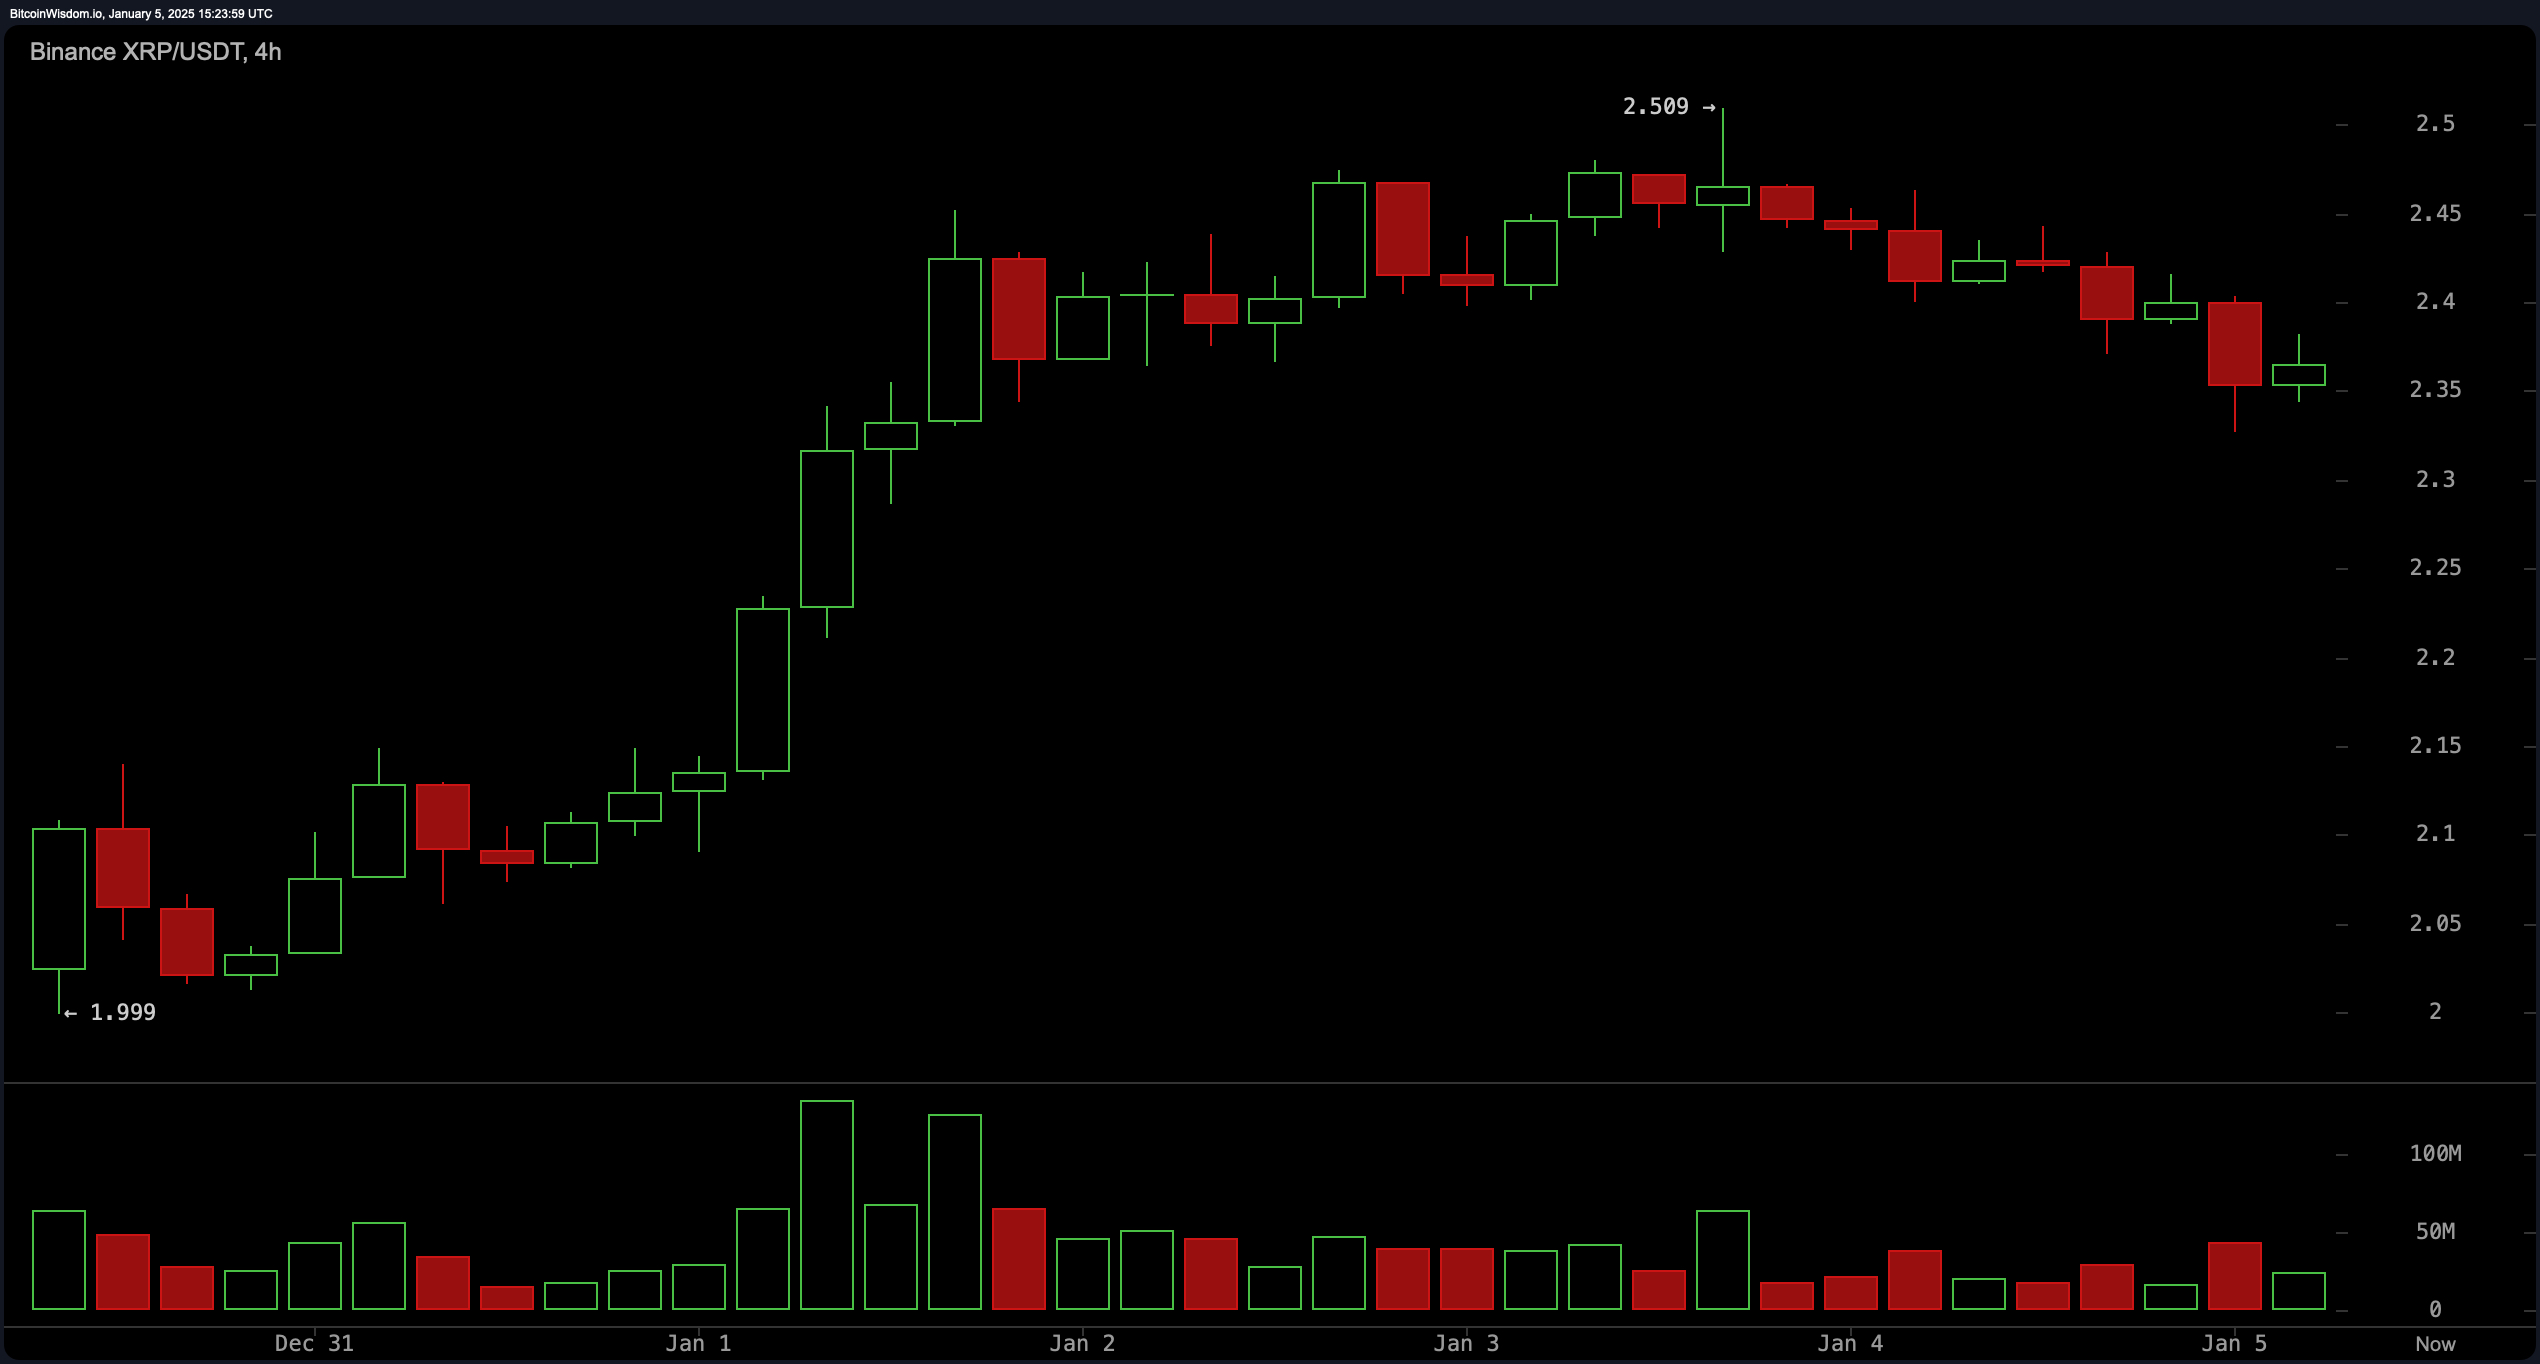
On XRP’s 4-hour chart, a lateral movement has set in post the recent peak of $2.50, with diminishing highs suggesting a possible retreat. Volume analysis shows a decline in activity at specific resistance points, signaling buyer fatigue. Support is confirmed at $2.35 and $2.20, providing potential for short-term long positions if the $2.35 support holds firm. While the Stochastic oscillator leans bearish, other tools like the awesome oscillator and MACD persist in offering buy signals.

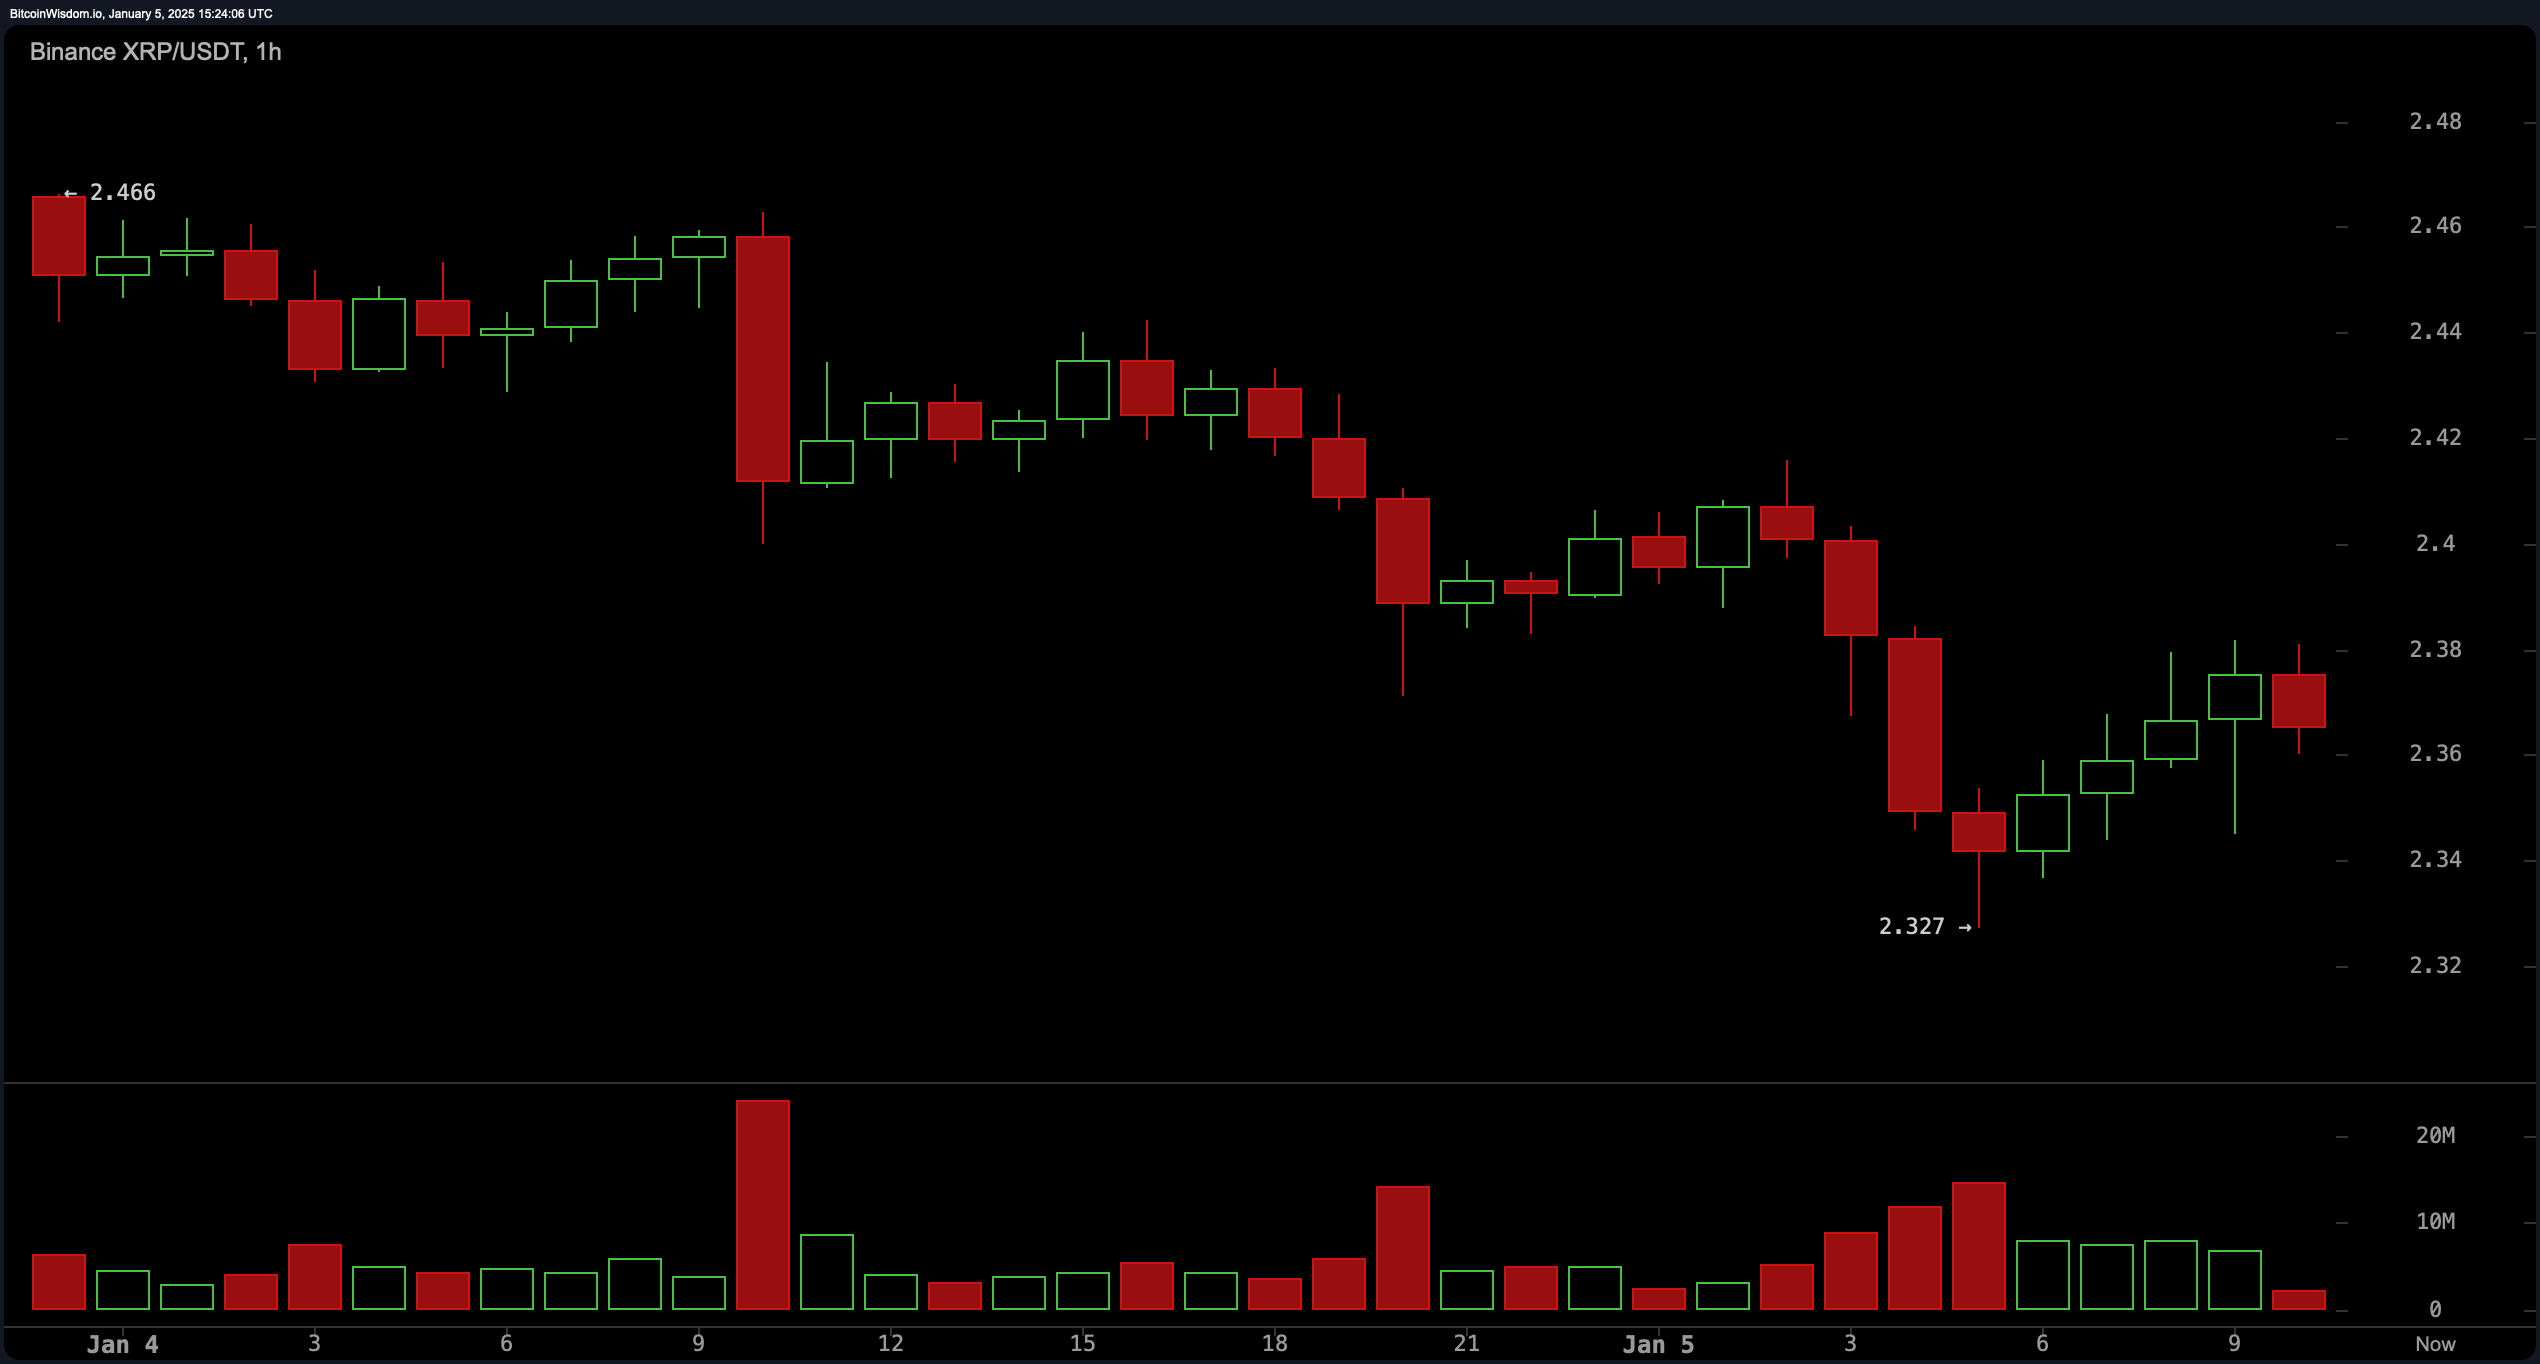
XRP’s hourly chart exhibits increased volatility, marked by a sharp fall from $2.50 to $2.35, followed by efforts to rebound. Resistance at $2.42 and $2.50 is pivotal, with the $2.35 level serving as a linchpin for short-term trading strategies. It’s prudent for traders to set stop-loss orders below $2.30 to manage risk exposure. Oscillators such as the relative strength index (RSI) (14) are neutral, while other momentum indicators display a mixed bag of sentiments.

XRP’s long-term moving averages, like the 100-period and 200-period EMAs and SMAs, continue to emit strong buy signals, reflecting a clear upward trajectory. The Ichimoku baseline indicates a market balance around the current price, instilling confidence in price stability near $2.35. However, the hull moving average (HMA) suggests selling pressure, calling for a measured approach.
Bull Verdict:
XRP’s overall trend remains bullish, supported by strong buy signals across long-term moving averages and momentum indicators. If the $2.35 support holds and the price breaks above the $2.50 resistance, the stage could be set for a rally toward $2.65 in the coming sessions.
Bear Verdict:
Despite longer-term bullish trends, short-term indicators show signs of exhaustion and selling pressure. A breakdown below $2.35 support could trigger a deeper pullback toward $2.20 or lower, driven by bearish signals from oscillators like the stochastic and hull moving average.
 news.bitcoin.com