Cardano’s price has been following Bitcoin over the past few weeks but is yet to create a new record high.
Yet, it might do so soon if it is able to take out this one significant obstacle.
By Edris Derakhshi (TradingRage)
The $USDT Paired Chart
On the $ADA/$USDT chart, the asset has been surging almost vertically, breaking above several resistance levels, including the 200-day moving average, which is a key trend indicator. However, the $1.2 resistance level has been preventing the market from rising further, and the price is consolidating below it at the moment.
While it seemingly creates a head and shoulders pattern, as long as the $0.75 support zone holds, the market structure will remain bullish, and a new record high will be within reach.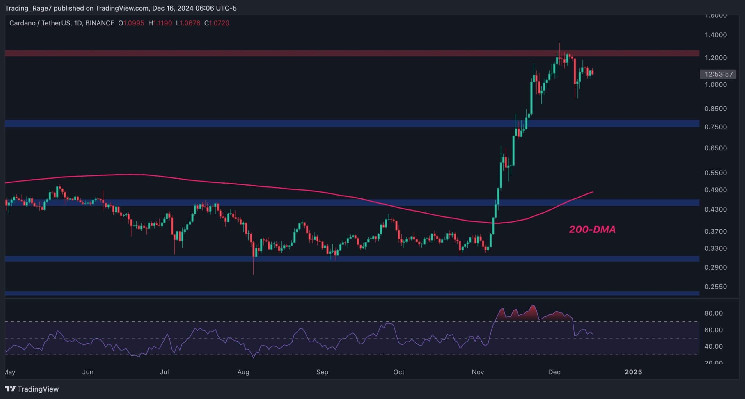
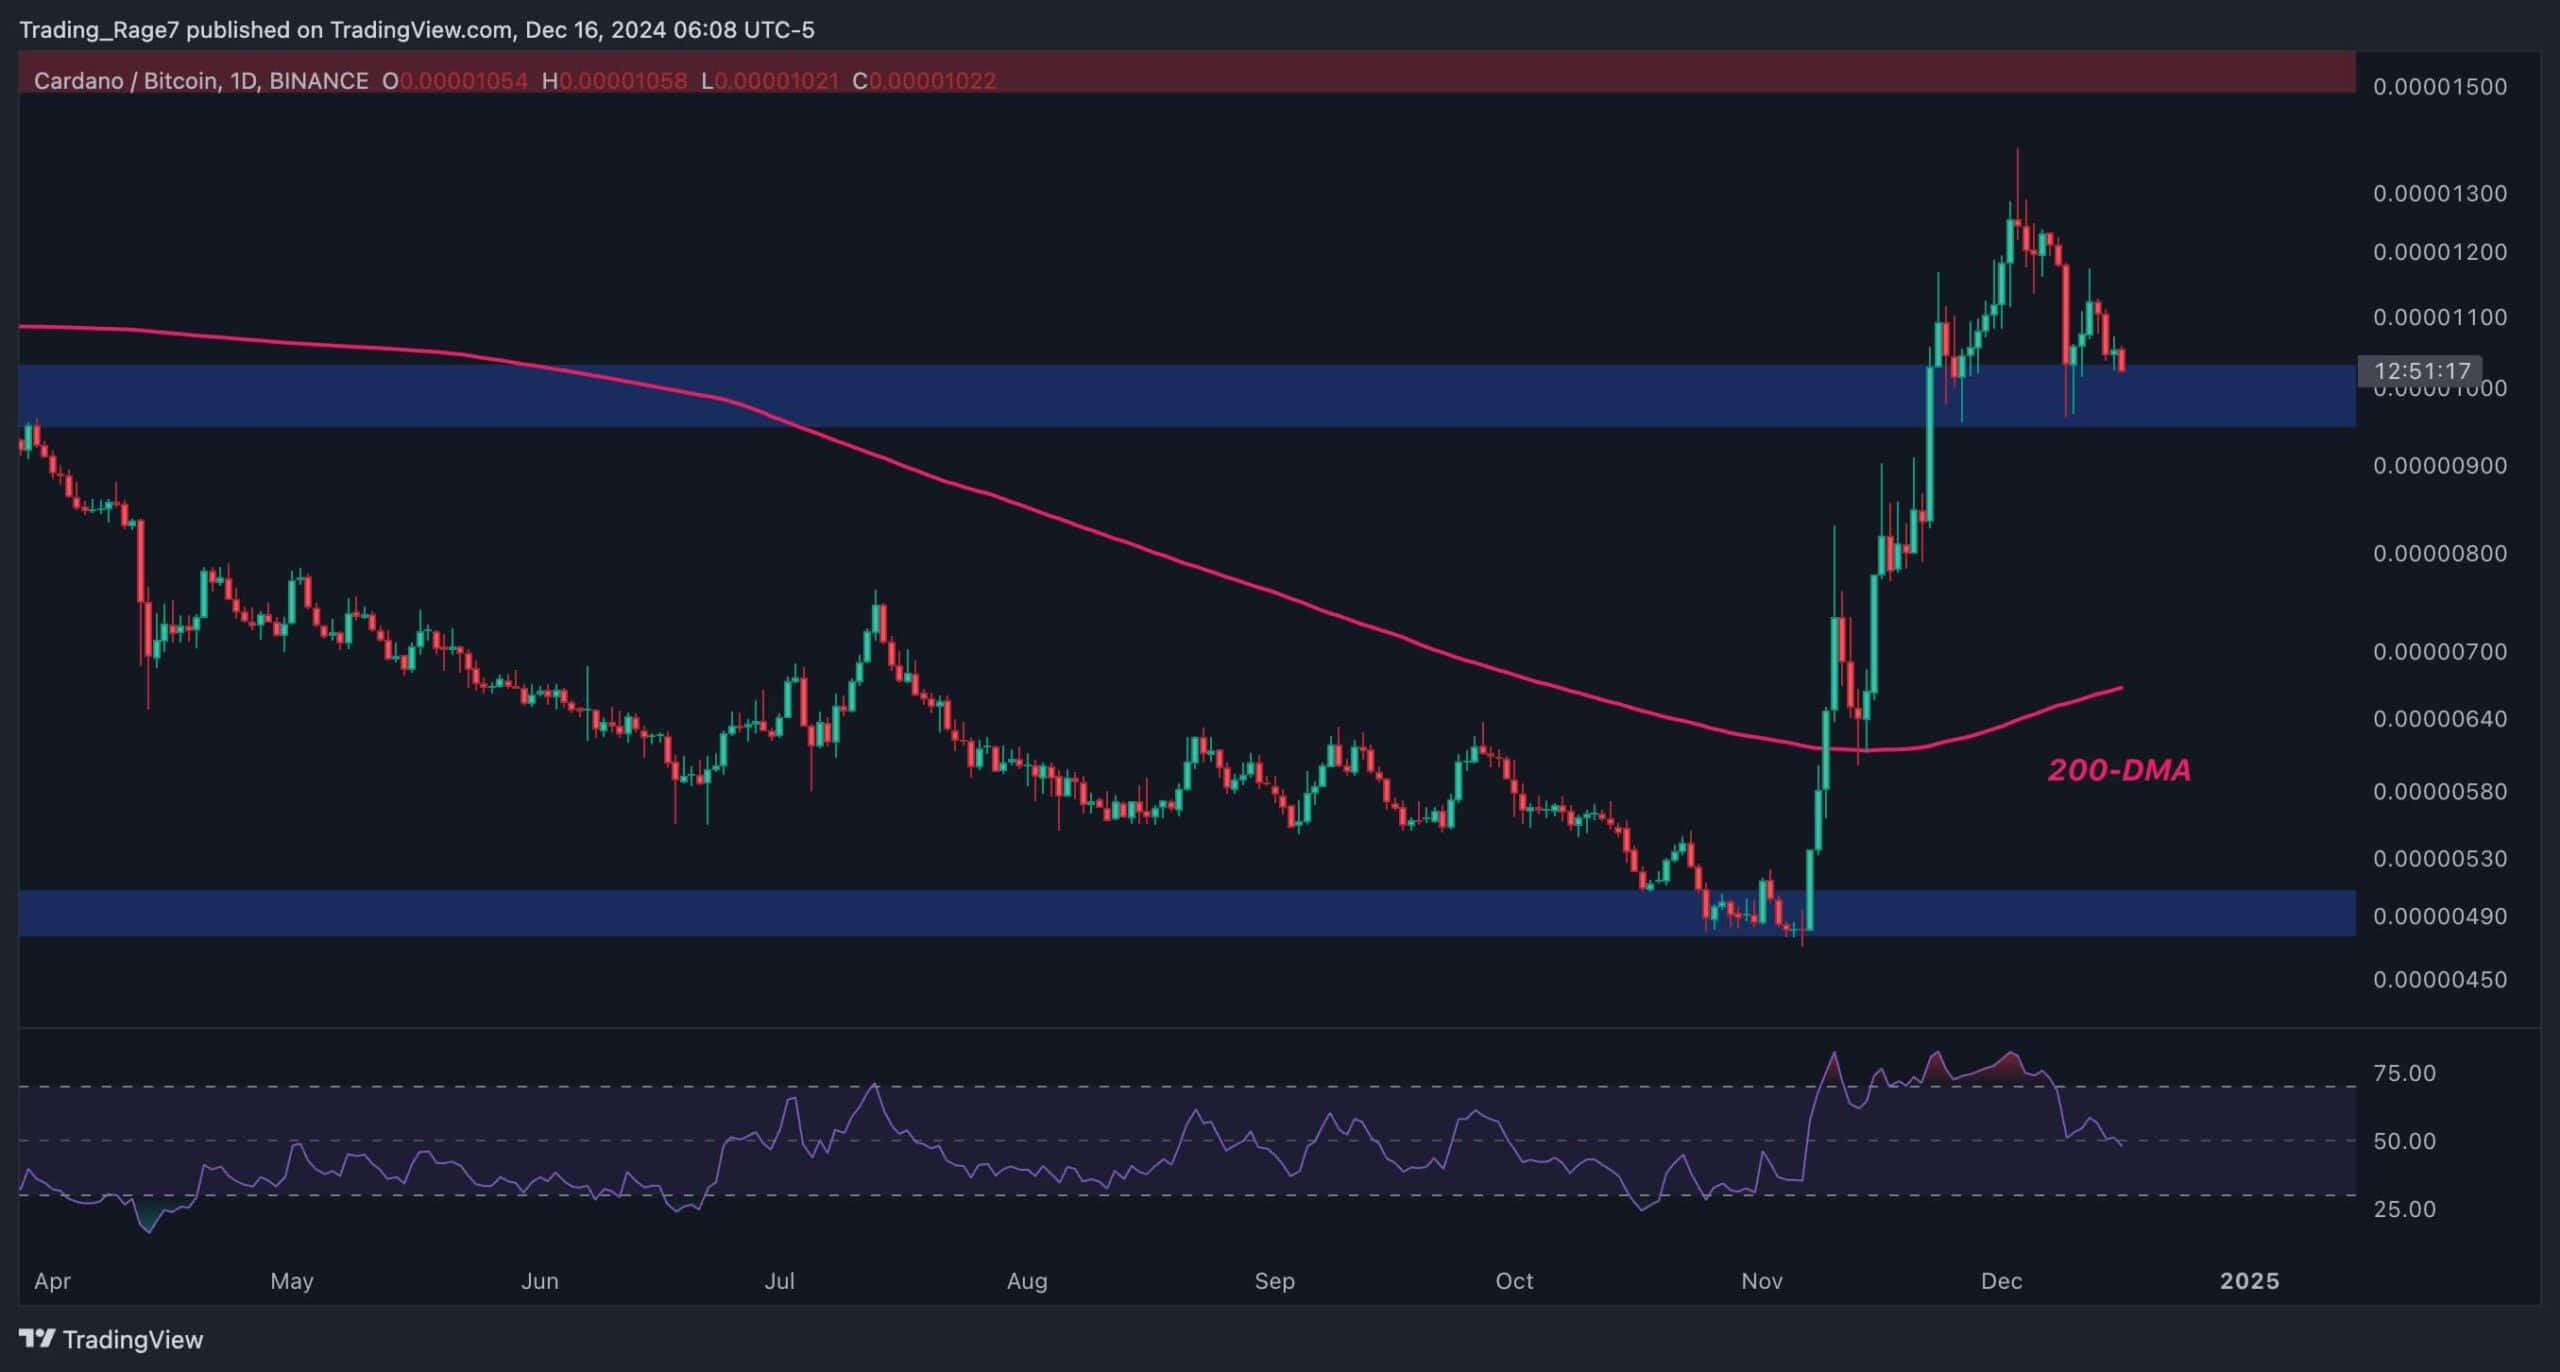
The $BTC Paired Chart
The Bitcoin-paired chart shows an almost similar picture to that of the $ADA/$USDT one, with a key difference. The $ADA/$BTC chart creates the head and shoulders pattern above a significant level, which is the 1000 SAT area. If the neckline of the pattern, which coincides with the 1000 SAT support level, breaks down, a drop toward the 200-day moving average, located around the 700 SAT mark, will be probable.
On the other hand, if the 1000 SAT area holds, a further rally toward the 1500 SAT resistance zone would be very likely in the coming weeks.