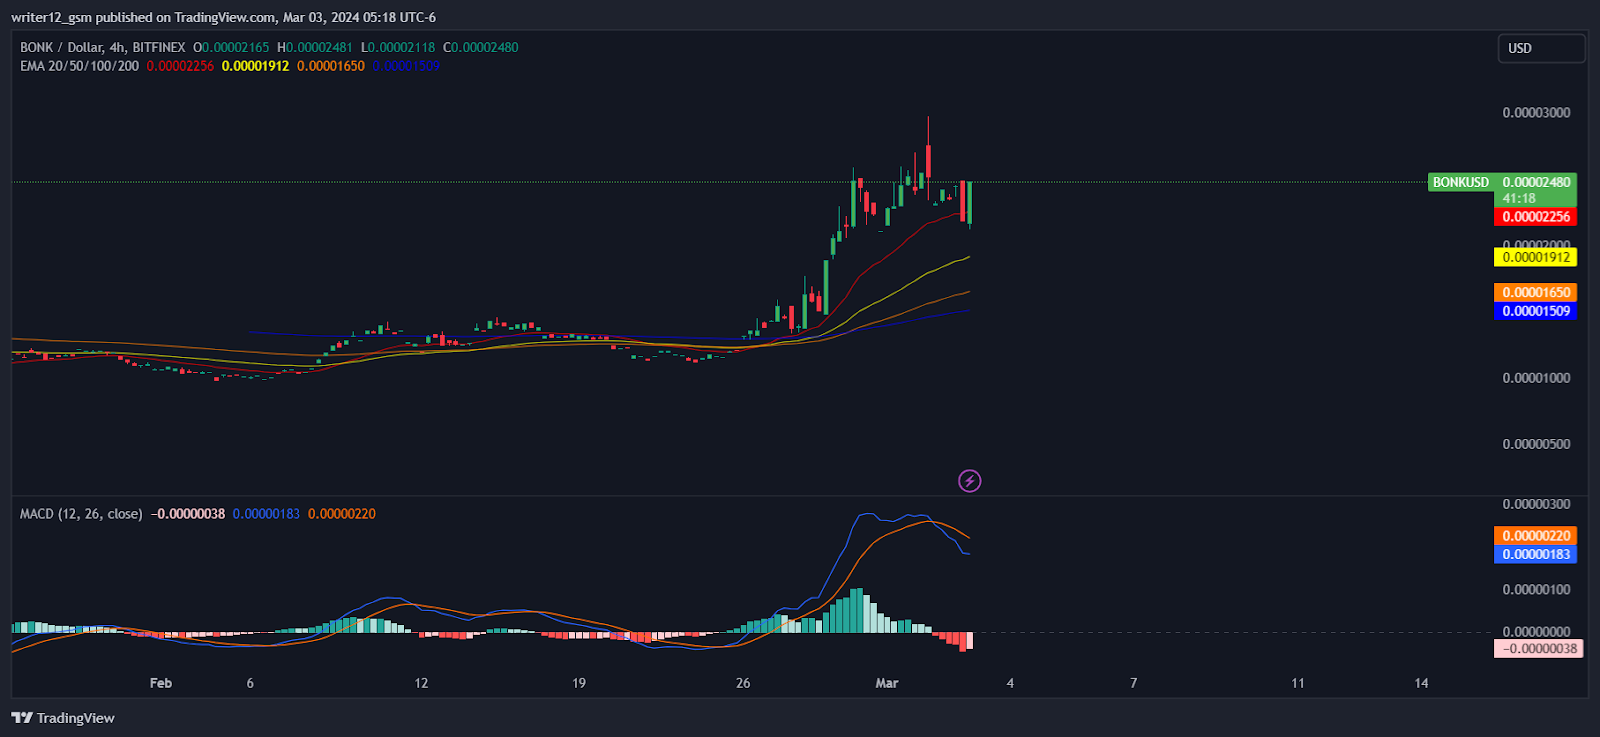
- 1 BONK crypto price is currently trading at $0.00002480 with a drop of 5.53% in the last 24 hours with a current market cap of $1.62 Billion.
- 2 BONK crypto price indicates bullishness and delivers a positive outlook.
- 3 Bulls are regaining strength and are trying to extend their gains in their last trading sessions.
BONK is trading in bullish territory, staying above major moving averages, indicating bullish momentum. The BONK cryptocurrency is moving higher on the daily chart and is above the 50-Day EMA.
This price action suggests that the cryptocurrency will likely experience a significant uptrend with a potential price increase in the upcoming sessions. Buyers are putting in a lot of effort to maintain these levels and show confidence in the uptrend of the cryptocurrency.
In recent trading sessions, bulls have indicated their strength. They have been consistently purchasing and accumulating additional cryptocurrencies to further advance the upward trend.
The recent surge in BONK cryptocurrency suggests a rise in bullish activity in the market. Furthermore, the price action continues to make higher highs and higher lows on the charts, indicating that the cryptocurrency is bullish, showing no signs of slowing down.
The chart structure shows that bulls are driving the trend and the cryptocurrency is gradually approaching the $0.00003000 mark, which it is likely to reach soon. Additionally, sellers have found themselves in a defensive position after breaking multiple resistance levels above $80 with significant vertical gains over the last few trading sessions. Investors are showing a strong intent to continue in this upward trend.
At the time of publication, the BONK cryptocurrency was trading at $0.00002480 with an intraday increase of 5.53%, showing an optimistic mood on the chart. It also has a trading volume of $533.29 Billion and a market capitalization of $1.62 Billion.
Technical Analysis of BONK Crypto Price

BONK’s price momentum is supported by it trading above its 50 and 200-Day simple moving averages (SMA). The current RSI value for BONK is 58.56 points, and the 14 SMA is at 64.58 points, indicating a bullish trend for the cryptocurrency.
The MACD line is at 0.00000178 and the signal line is at 0.00000219, with both lines above the 0 line. However, there is a bearish crossover in the MACD indicator, revealing weak momentum in the price of the BONK cryptocurrency.
Summary
Technical oscillators are supporting the bullish trend. The MACD, RSI, and EMA indicators suggest that the bullish trend in BONK cryptocurrency is likely to persist. Positive price action reflects daily optimism among investors and traders. Price action suggests that investors and traders are optimistic on the daily chart. However, investors and traders must wait to be properly prepared for the next step and avoid FOMO.
Technical Levels
Support Level: $0.00002000
Resistance Level: $0.00003000
Disclaimer
This article is for informational purposes only and does not provide any financial, investment, or other advice. The author or any people mentioned in this article are not responsible for any financial loss that may occur from investing in or trading. Please do your own research before making any financial decisions.
Amanda Shinoy is one of the few women in the space invested knee-deep in crypto. An advocate for increasing the presence of women in crypto, she is known for her accurate technical analysis and price prediction of cryptocurrencies. Readers are often waiting for her opinion about the next rally. She is a finance expert with an MBA in finance. Quitting a corporate job at a leading financial institution, she now engages herself full-time into financial education for the general public.
 thecoinrepublic.com
