- 1 MATIC price chart displays a V-shaped reversal; pullback is anticipated.
- 2 Buyers are looking to surpass the round mark of $1 soon.
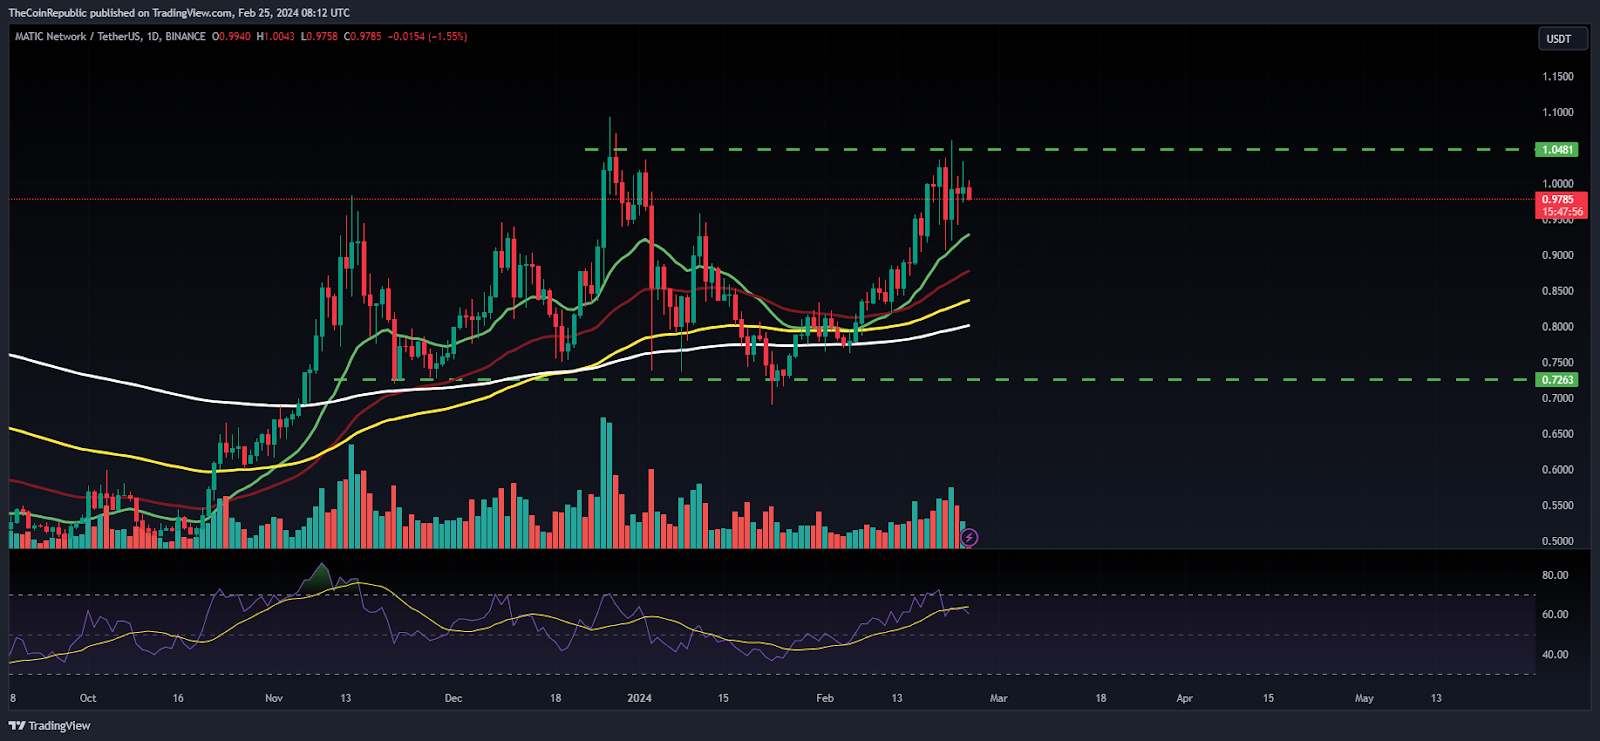
Polygon (MATIC) coin revealed a sharp bounce and retained momentum, reaching close to the round mark of $1. Moreover, the bulls have regained strength and are anticipating a breakout soon. The coin signifies a V-shaped reversal and depicts follow-on buying momentum. However, the coin needs a retracement to continue the upward movement, which might lead to a breakout above $1.
MATIC coin price surpassed the key moving averages and delivered a pullback in the last sessions. Furthermore, the trend is neutral, and buyers must hold $0.900 to continue the bullish momentum. If the coin drags below $0.8500, it may lead to profit booking toward $0.500. Per the Fib levels, the coin has escaped the 23.6% zone and is close to the 38.2% zone.
The Polygon coin (MATIC) price was $0.9807 at press time, with an intraday drop of 2.71%, showing neutrality on the charts. Moreover, the trading volume has increased by 4.31% to $320.02 Million. The pair of MATIC/BTC is at 0.0000189 BTC, and the market cap is $9.44 Billion. MATIC coin has a weekly return ratio of 5.42% and 33.64% monthly. Analysts are neutral and suggest that the Polygon crypto (MATIC) price will face volatility and may breach the round mark of $1 soon.
MATIC Displays Rebound From Key Support Zone

Polygon (MATIC) chart revealed a bounce from the critical support zone of $0.7000 and retained buying momentum in the recent sessions. The coin has recovered over 46% of gains and retained its bullishness. However, the coin is yet to surpass the round mark of $1, which, if it happens, the price would rise to $1.20, followed by $1.50. The trend is neutral, however, the bulls continue to accumulate gains and are aiming for a breakout.
The RSI curve continues to stay in the overbought zone forming a positive crossover, and revealing the bulls’ accumulation. Similarly, the MACD indicator shows a bullish crossover, it formed green bars on the histogram which suggest a bullish outlook for the following sessions.
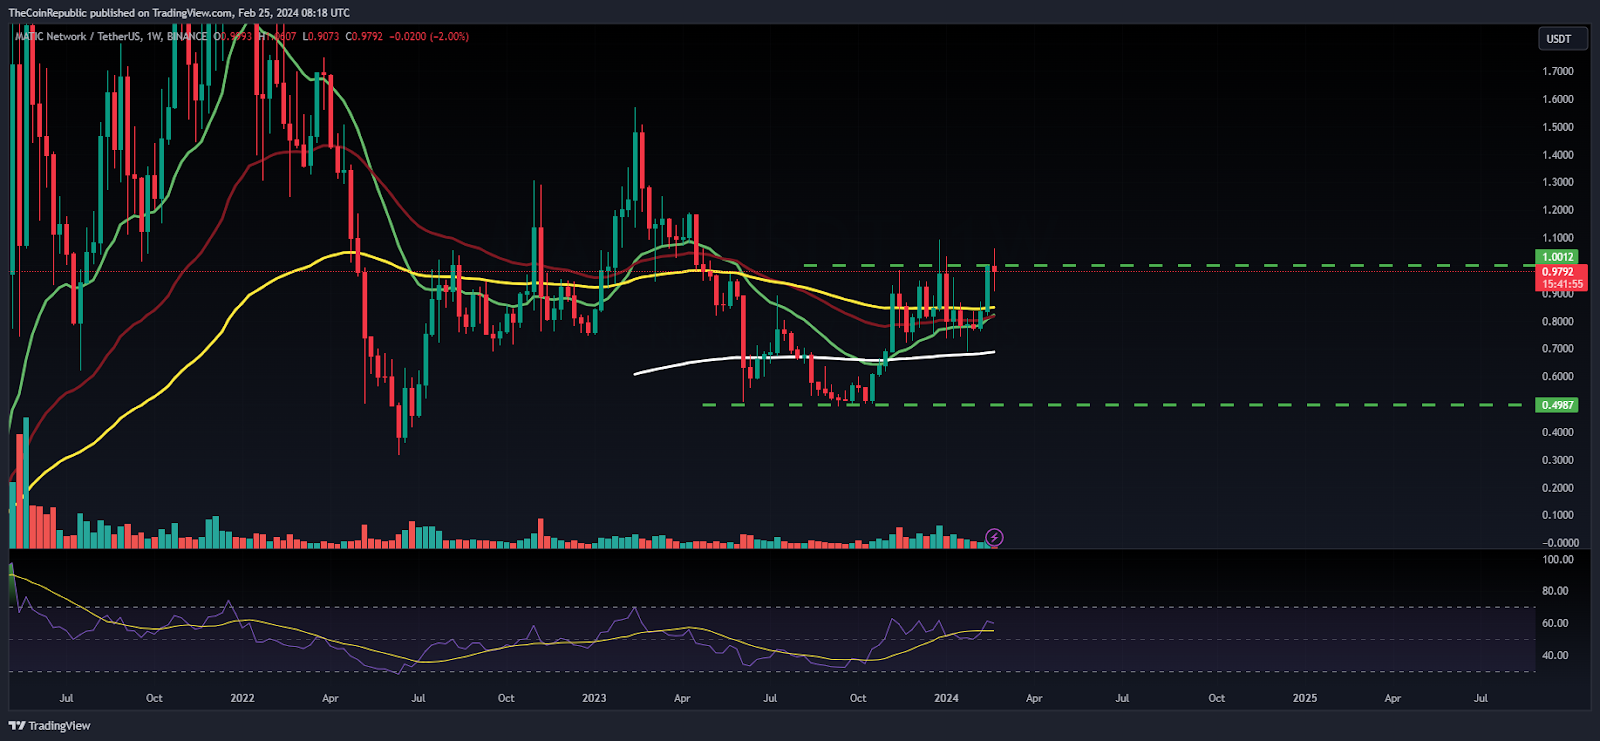
MATIC Displays Consolidation On Weekly Charts

MATIC coin displays range-bound moves and is hovering below the $1 mark for the last sessions. However, the coin showed a bounce and escaped the 100-Day EMA sharply, signifying the bulls’ intention to initiate a range breakout. Until the $1.20 mark is not breached, the coin will hover in range and will not succeed in breaking out.
Summary
Polygon (MATIC) coin displays a rebound from the demand zone and has been consolidating in a range for the past weeks. Furthermore, the price action indicates volatile moves, and buyers are struggling to escape the round mark of $1.
Technical Levels
Support Levels: $0.9600 and $0.9200
Resistance Levels:$1 and $1.10
Disclaimer
The views and opinions stated by the author or any other person named in this article are for informational purposes only and do not constitute financial, investment, or other advice.
Andrew is a blockchain developer who developed his interest in cryptocurrencies while pursuing his post-graduation major in blockchain development. He is a keen observer of details and shares his passion for writing, along with coding. His backend knowledge about blockchain helps him give a unique perspective to his writing skills, and a reliable craft at explaining the concepts such as blockchain programming, languages and token minting. He also frequently shares technical details and performance indicators of ICOs and IDOs.
 thecoinrepublic.com
