- Polkadot overcomes key resistance levels, showing a 30% increase in two weeks, generating strong investor interest.
- Mixed technical analysis: positive RSI suggests momentum, but MACD indicates volatility and possible downside; investors should exercise caution.
Polkadot (DOT), one of the most prominent digital currencies, has recently surpassed a key resistance level, generating growing investor interest and speculation about its future value. With a notable increase in its value, Polkadot’s price has been in the spotlight, triggering discussions about possibly reaching a new $7 milestone.
The Rising Crypto Market: A Background for Polkadot’s Success
The total crypto market capitalization has reached a significant milestone of $1.6 trillion during early trading hours today, reflecting strong bullish sentiment in the cryptocurrency space. Polkadot, in particular, has captured the market’s attention by successfully breaking through its key resistance level, indicating a growing demand for this digital currency.
Polkadot’s Price Journey
Polkadot initially traded in a tight range between $4,319 and $4,535, after which the bulls regained momentum, leading to a breakout point in price. The DOT currency experienced minor fluctuations in price before steadily gaining momentum.
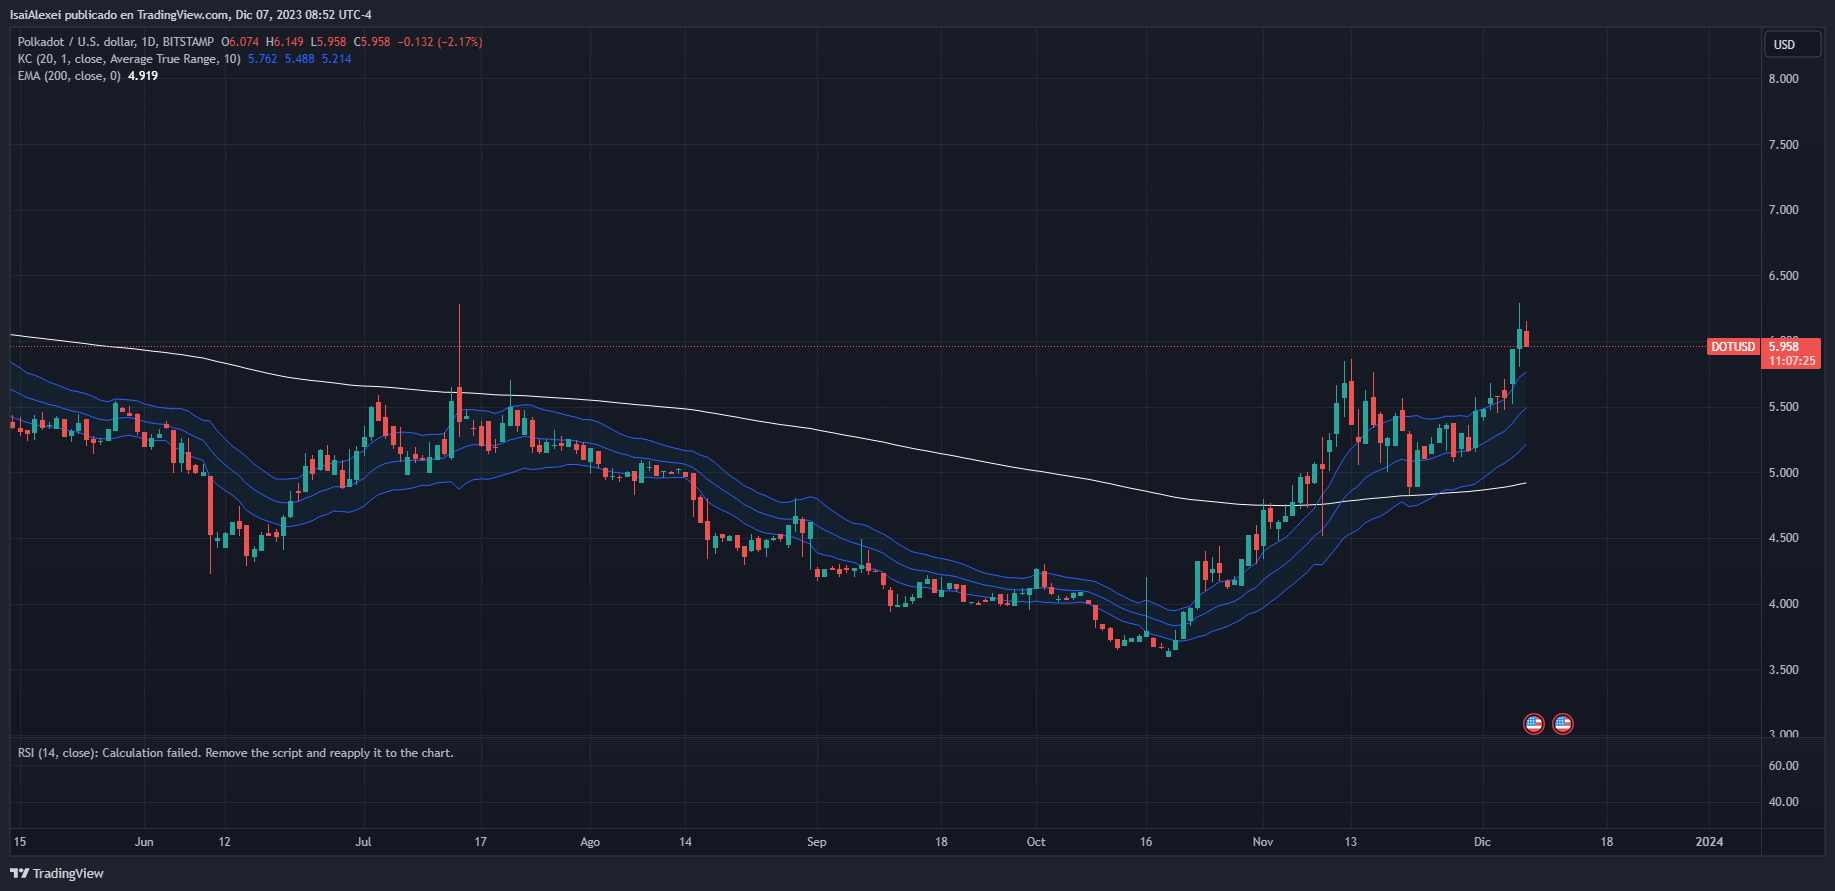
Despite facing price rejections at $5,818 and a 12% correction, Polkadot posted an impressive 30% increase in value in just two weeks. After trading in a consolidated range, DOT’s price finally broke through its key resistance level at $5,818, although this rally was short-lived, as it faced a rejection at $6,127.
Technical Analysis: A Fluctuating Road to Success
Technical indicators offer a mixed outlook. On the one hand, technical analysis shows positive growth, supported by performance in the moving averages and a 57% increase in 24-hour trading volume to $293 million, underscoring growing investor interest.

Tradingview: DOTUSD_2023-12-07_08-52-35
On the 24-hour price chart of DOTUSD, the Relative Strength Index (RSI) is at 58.55, moving above its signal line, indicating that positive momentum is building for DOT. However, the MACD indicator shows a more volatile future, with a bearish crossover indicating the need for short-term caution.
The Investment Outlook: Interest and Caution
The 24-hour trading volume has seen a 57% increase to $293 million, underscoring growing investor interest in Polkadot. The Relative Strength Index (RSI) on the 24-hour price chart of DOT/USD shows a value of 5,855 and a move above its signal line, indicating growing positive momentum. However, the MACD indicator signals a more volatile future with a bearish crossover, suggesting caution in the short term.
Polkadot Future: What Can We Expect?
The outlook for Polkadot looks promising, but it is not without uncertainties. If the bulls manage to push the price above the $6.12 resistance level, renewed momentum could be expected, aiming to test the upper resistance level of $6.407 in the coming days.
Recommended for you
• Shiba Inu’s Shibarium: A Major Hard Fork Signals Exciting Changes• Versatus: Leading the Web3 with an Innovative Stateless Rollup• Cardano’s ADA Rockets to New Heights: $1 Billion Surge in Just 24 Hours
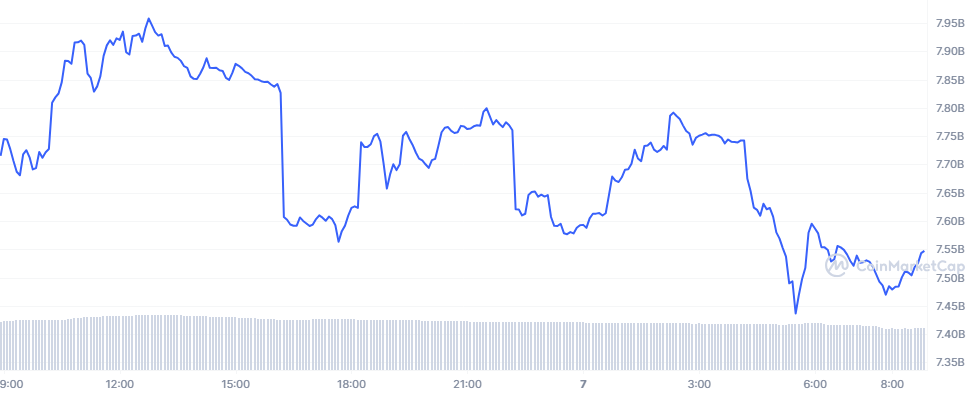
Source: Coinmarketcap: DOT_1D_graph
In contrast, if they fail to hold the price at that level, Polkadot could lose momentum and test its support level of $5,818. Moreover, if the bears continue to dominate, the price could fall further, testing its lower support level of $5,526 in the following week.
Polkadot’s current market situation is a clear example of the volatility and constantly changing dynamics of cryptocurrencies. As investors and cryptocurrency enthusiasts watch closely, Polkadot’s future, while uncertain, looks promising. With a strong community and growing investor interest, it remains to be seen whether Polkadot will reach and surpass the $7 mark, marking another exciting chapter in cryptocurrency history.