- 1 Monero’s price (XMR) slid 5.94% in the last 24 hours and is currently trading at $144.30.
- 2 Monero price (XMR) failed to break above the trendline resistance after consolation and slid down.
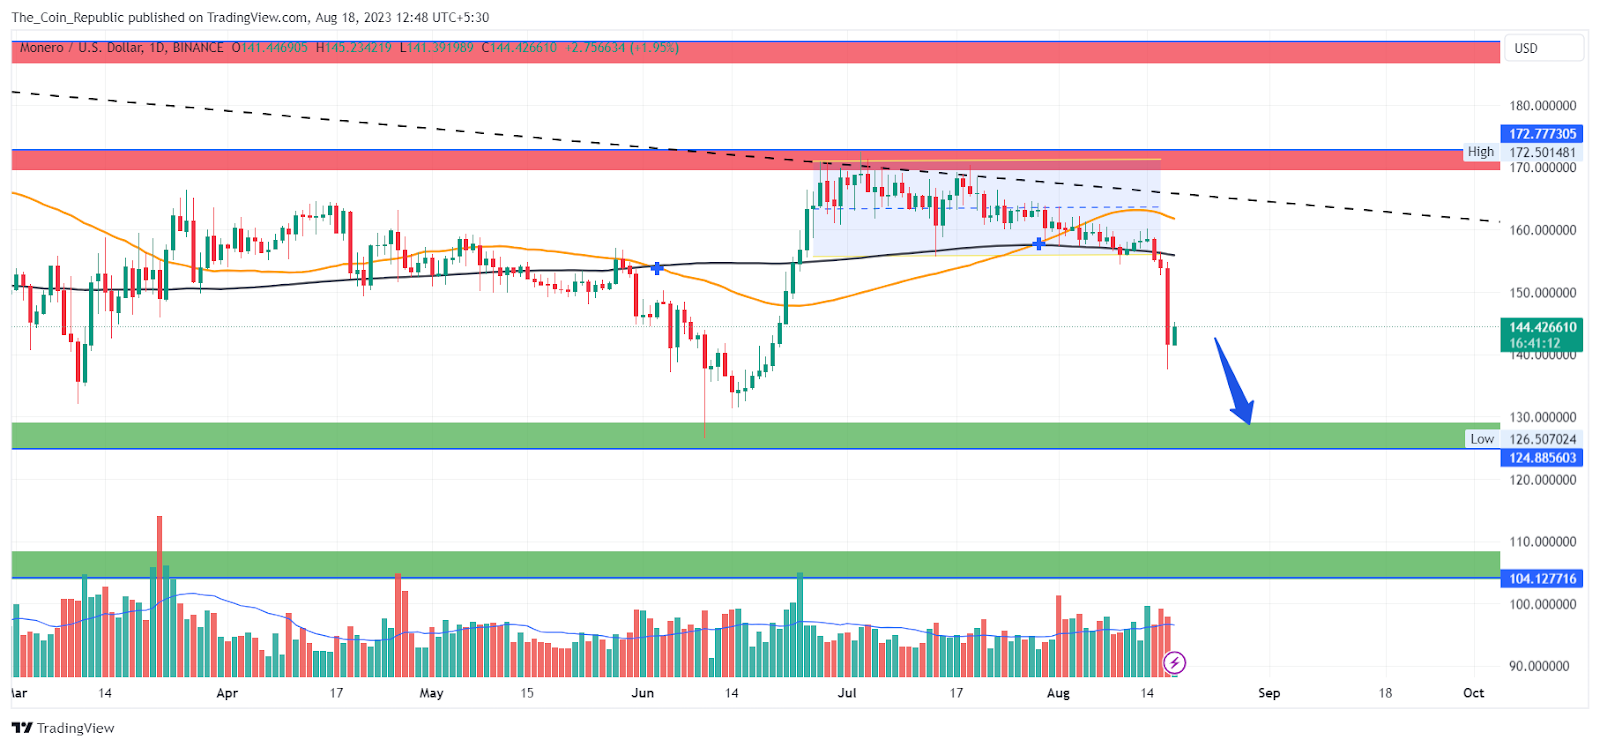
The Monero coin has been in a correction phase since June 2022 when it declined nearly 50 to form a new swing low. Since then, the price has been trading and narrowing in the range with resistance as an upper trendline and the swing low acting as a support.
Recently, the price took a rebound from the lower demand zone and tried a recovery. However, the presence of sellers near the trendline halted the momentum followed by a consolidation, and led to the failure of an attempt to shift the trend.
Monero (XMR) strives for maximum decentralization, so users don’t need to trust anyone else on the network. It also ensures privacy by hiding the identities of senders, recipients, and the amount of crypto transferred. Unlike Bitcoin, which has traceable serial numbers, XMR is fungible and interchangeable. Monero claims to have an edge over other privacy coins like Zcash, which only offer optional anonymity.
Monero Price Forming A Descending Triangle Pattern On The Daily Chart

Currently, the price is declining after a consolidation near the trendline resistance indicating that the correction period is not yet over. The price may again decline to get the support of buyers near the previous demand zone. The analysts are also having a bearish outlook in the short term as the dollar index is rising.
The long-term trend is already bearish and maintains the same until the price changes its character to break above the previous swing high and starts forming higher lows on the daily chart.
XMR Price Prediction From Technical Indicators Point of View.

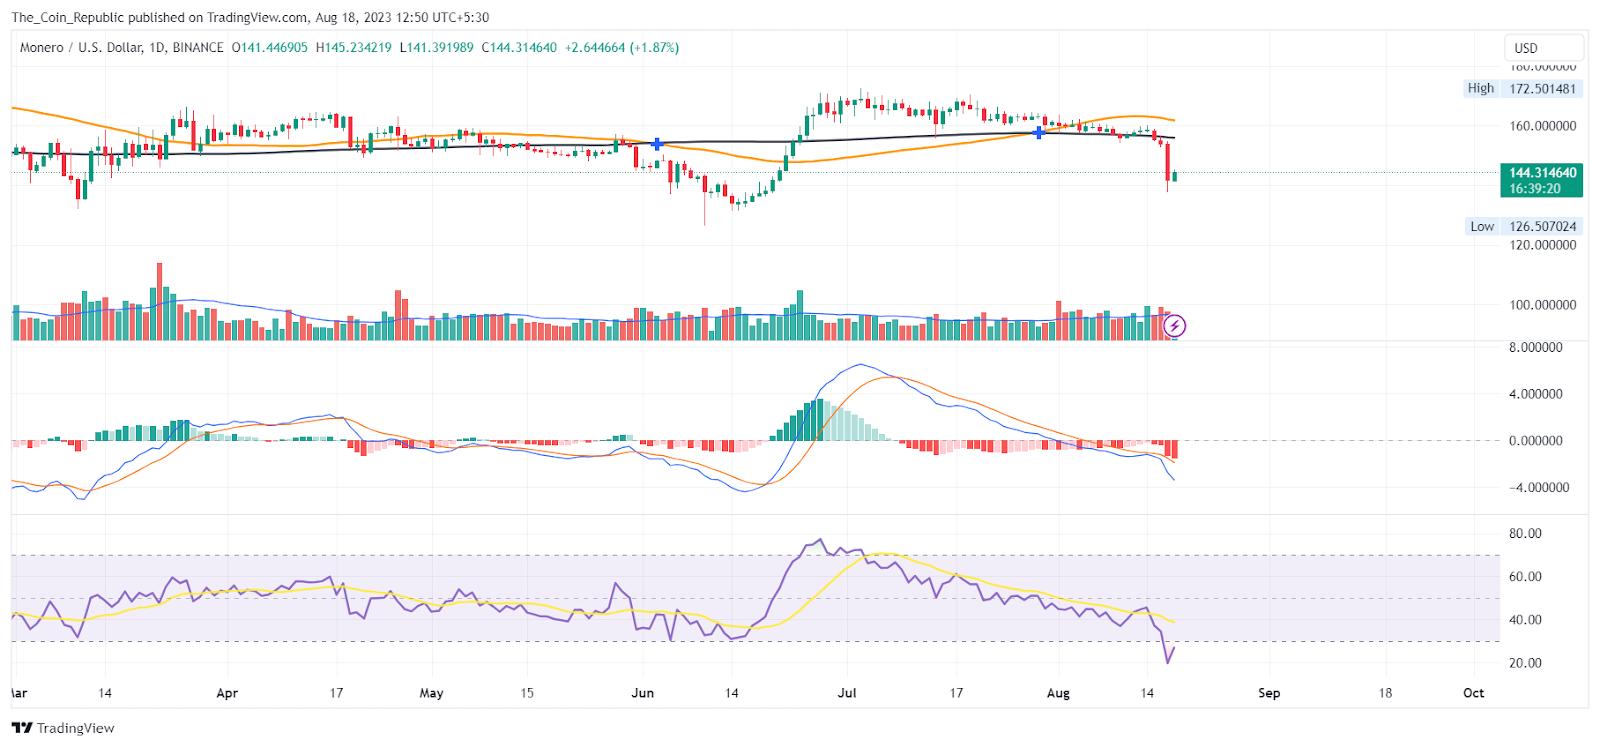
At the time of publishing, the RSI value of the XMR token is 20, and that of the SMA line is 39. RSI has entered an oversold zone indicating the dominance of sellers in the market.
As per the EMA analysis, the XMR price could not sustain above the 200 EMA indicating the selling pressure in the market.
MACD lines have formed a bearish crossover. Also, histogram bars are formed below the mean line with increasing height signaling weakness in the market.
Conclusion
Monero’s price prediction concludes that the coin is in a downtrend since June 2022, trading in a narrow range between a trendline resistance and a swing-low support. The price bounced from the support recently but failed to break the resistance and resumed its decline. The price may test the support again, as analysts are bearish in the short term due to the rising dollar index. The long-term trend is also bearish unless the price makes higher highs and lows. The technical indicators are also showing weakness and signal the continuation of the declining trend in the short term.
Technical Levels
- Support levels: $124.88 and $104.12.
- Resistance levels: $172.7 and $190.16.
Disclaimer
The views and opinions stated by the author, or any people named in this article, are for informational purposes only and do not establish financial, investment, or other advice. Investing in or trading crypto or stock comes with a risk of financial loss.
 thecoinrepublic.com
