Meanwhile, at press time, CoinMarketCap indicated that $LINK had suffered a 0.61% 24-hour loss. Consequently, the altcoin was changing hands at $7.16. This negative daily performance pushed the cryptocurrency’s price further into the red zone to -5.83%.
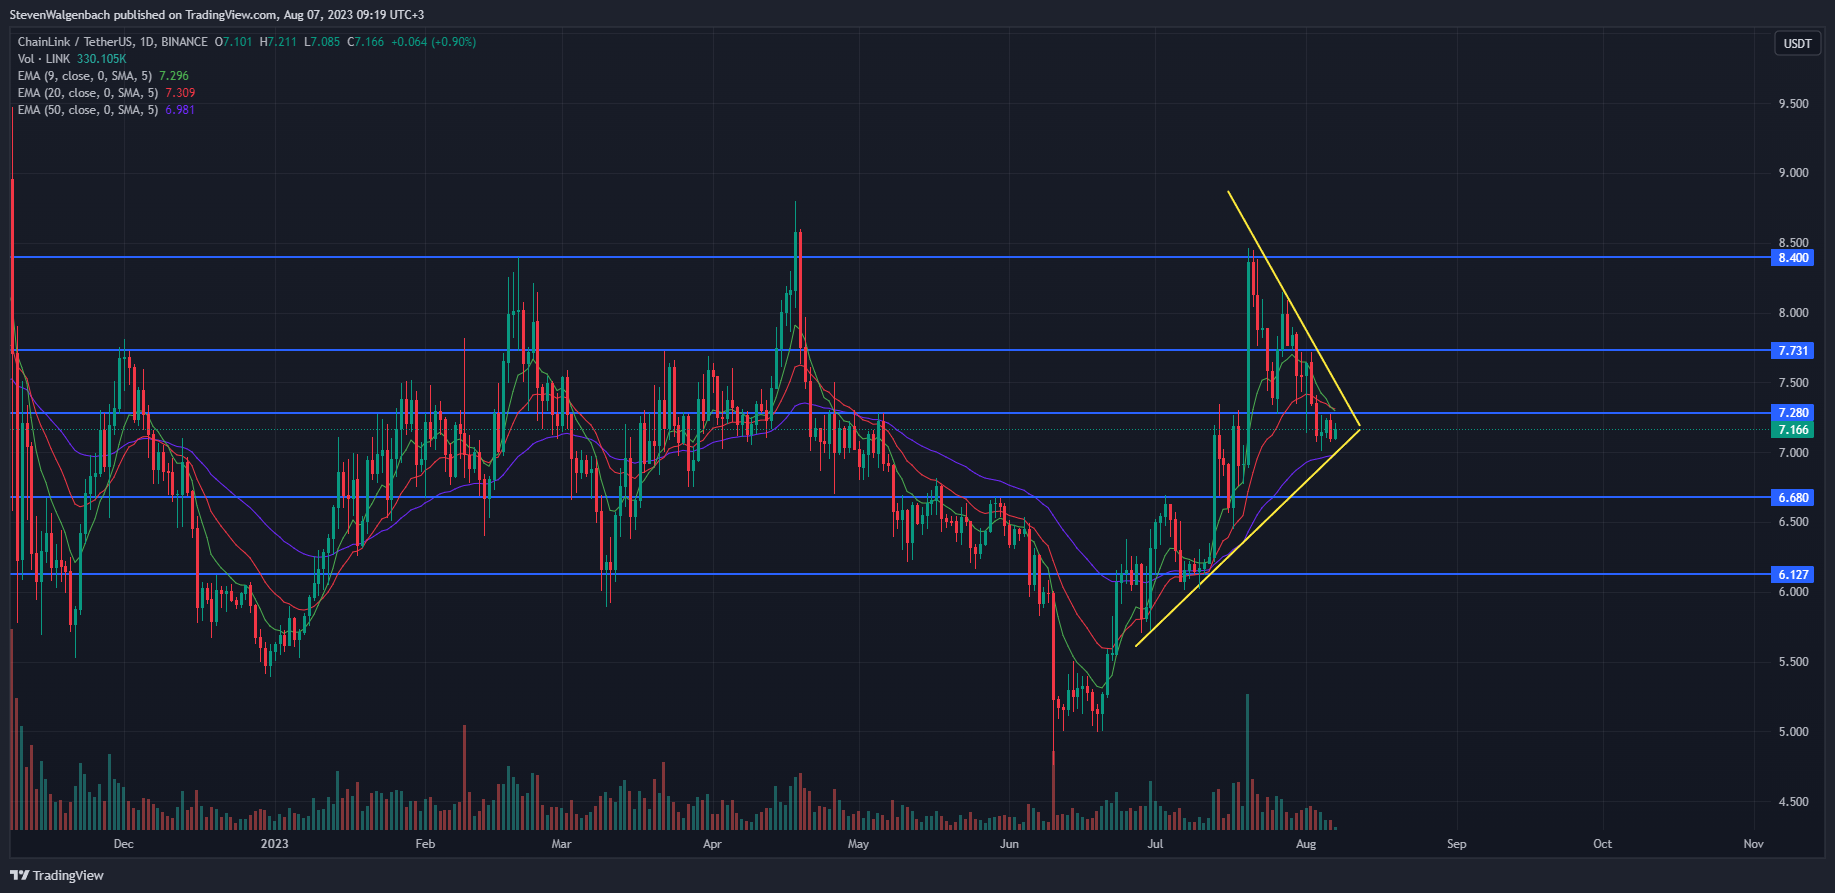
Daily chart for $LINK/USDT (Source: TradingView)
From a technical perspective, a breakout in $LINK’s price may ensue in the coming couple of days given the fact that a symmetrical triangle pattern had formed on $LINK’s daily chart. Should this break be toward the upside, the altcoin’s price may rise to $8.40 in the next 2 weeks. Conversely, a negative breakout may lead to $LINK dropping to $6.127.
A confirmation of the positive breakout will be when $LINK’s price breaks above the 9-day and 20-day EMA lines at around $7.31. This will also result in $LINK’s price flipping the resistance level at $7.280 into support. Continued buy pressure at this point could then lead to $LINK overcoming the next resistance at $7.731 before potentially climbing to $8.40.
On the other hand, a confirmation of a negative breakout will be when $LINK’s price drops below the 50-day EMA line at around $6.981. Following the break below this technical indicator, $LINK may fall to the support level at $6.680. If sell pressure persists, the altcoin’s price may fall to the aforementioned $6.127 mark.
One technical flag suggested that the bearish thesis will most likely play out. At press time, the 9-day EMA line was attempting to cross bearishly below the 20-day EMA line. Should this cross happen, it will indicate that $LINK’s price has entered into a short-term negative trend and its price may continue to fall in the next week.
Disclaimer: The views and opinions, as well as all the information shared in this price analysis, are published in good faith. Readers must do their own research and due diligence. Any action taken by the reader is strictly at their own risk. Coin Edition and its affiliates will not be held liable for any direct or indirect damage or loss.

 coinedition.com