coindesk.com

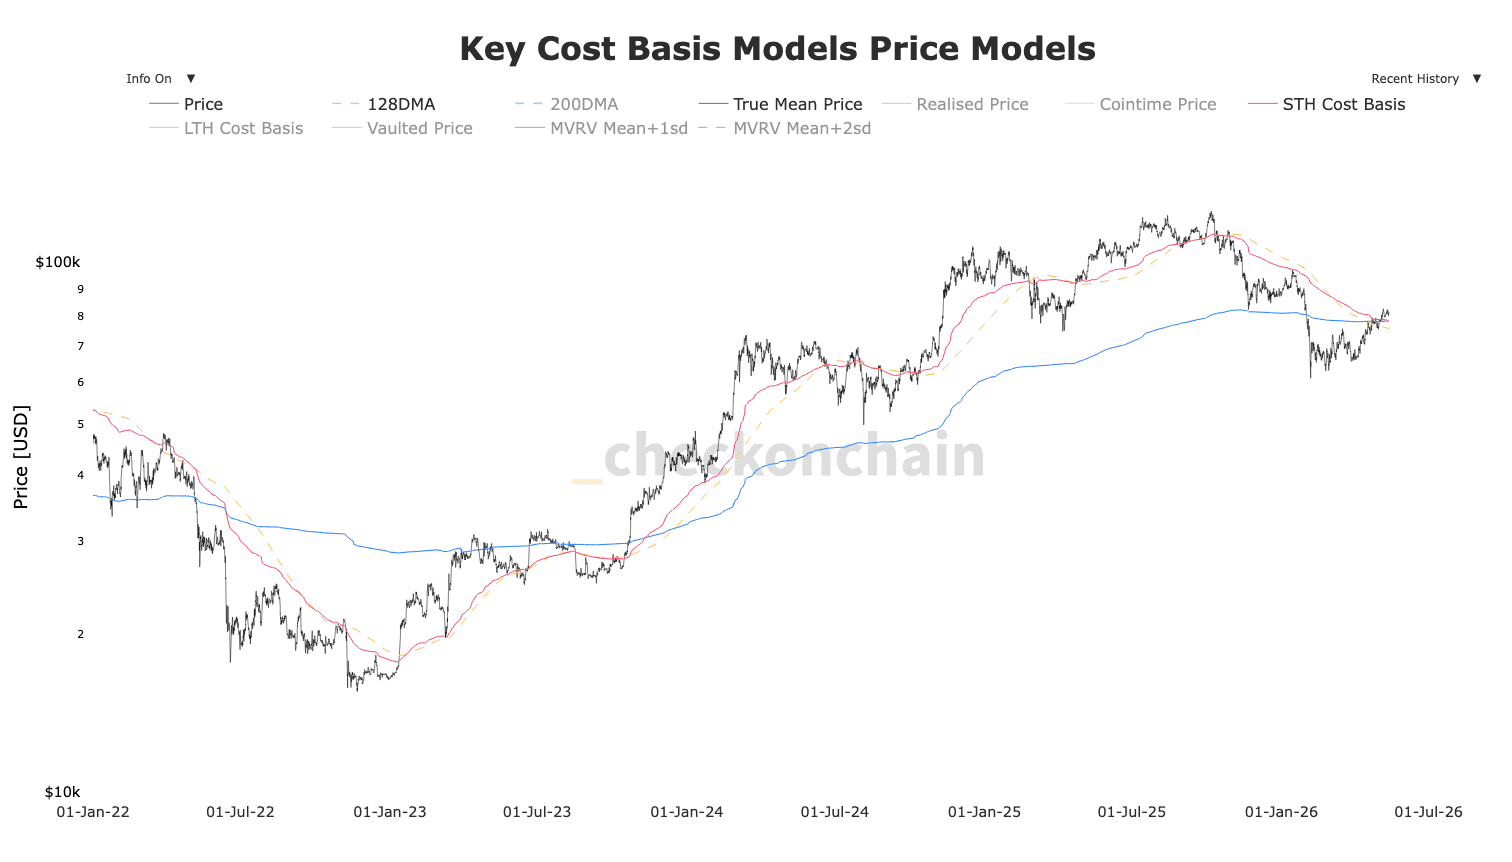
Bitcoin is fighting a key technical battle and is trading just below two closely watched long-term trend indicators: the 200-day Simple Moving Average (200SMA) at $82,455 and the 200-day Exponential Moving Average (200EMA) at $82,027, according to Glassnode data.
The 200SMA calculates the average closing price across the last 200 days, weighting each day equally. The 200EMA uses the same 200-day window but places greater emphasis on more recent prices, making it slightly more responsive to current market conditions.
Together, they form a confluence resistance zone around $82,000–$82,500 that bitcoin must convincingly reclaim to signal a recovery of its long-term uptrend.
Bitcoin first lost the 200DMA in late November 2025, when the price rolled over from $108,000. A brief recovery attempt in January failed to reclaim the level around $97,000 and by early February 2026 bitcoin had fallen to $60,000.