- 1 Monero price currently trades at $163.1 while witnessing a 0% change at the time of writing.
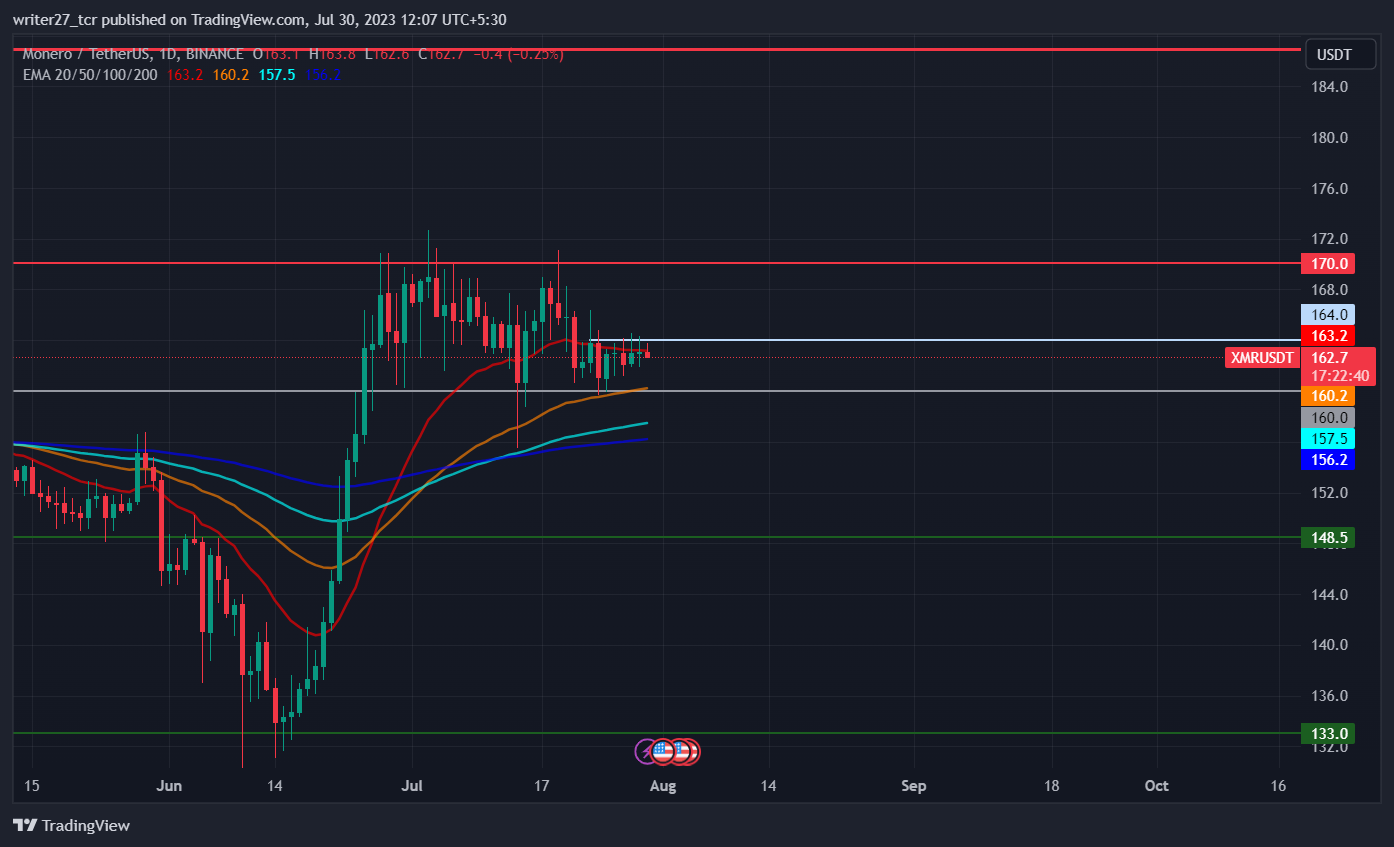
- 2 XMR price has slipped below 20-day EMA but still trades above 50,100 and 200-day EMAs.
- 3 The year-to-date return of Monero is 10.73% while the six-month return is -7.33%.
XMR’s price ran to the upside in a way it never has before during the end of June, after forming the support level of $133. The cryptocurrency price was bullish for thirteen consecutive days and formed a high of 172.7.
Following the bullish rally, Monero’s price entered into a consolidation zone ranging between $170 and $160. The oscillation was going on since the start of July which show that bulls are holding on to their position and expect another bullish rally.
If buyers can push the price above $170, XMR/USDT might start the next leg of the upward move. The next bullish move can skyrocket the price toward the annual high and resistance level of $188.
Is Monero Presenting a Shorting Opportunity?

The seller needs to push the price below $150 and a 50-day EMA to seize control. If a candle can close below $160 and there is follow-up momentum, the price might fill the lower wick of the 14 July candle and head further downwards.
The current price action shows that the price is firmly restricted below the $164 level since the past week. The price has rejected $164 several times in the past days indicating that bears have started to enter the market.
A candle close above $164 can validate a bullish move toward the major resistance of $170. The previous candle closed as a Doji and if the current candle breaks the low, the XMR price might melt to $160. The market capitalization is down by 0.15% to $2,985,980,461. The 24-hour trading volume has also declined by 40.60%.
Will XMR Price Sustain Above $160?

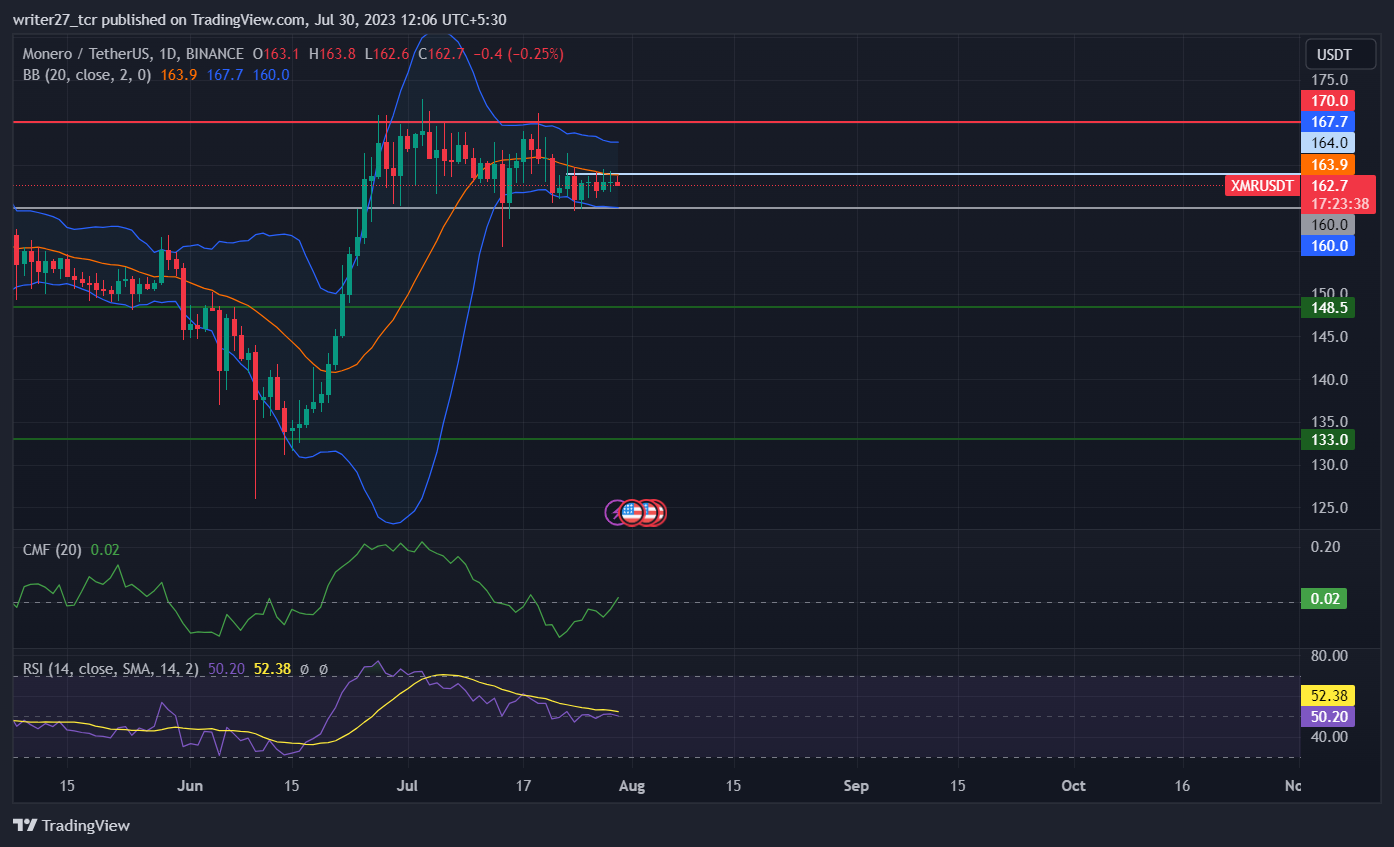
The cryptocurrency price has slipped below the 20-day Exponential Moving Average (EMA) and is currently rejecting it, suggesting rising bearish momentum. Chaikin money flow score has returned back above the 0 mark, indicating improved capital inflow in Monero and slight strength in the market.
The Relative Strength Index (RSI) is trading at 50.45 in the neutral region implying the same pressure on both buying and selling side. The bands of Bollinger have also contracted signifying low volatility in the market.
The price is headed in the direction of the lower band after rejecting the 20-day SMA which resides at the $160 level. The long/short ratio is 0.88 with 46.94% longs and 53.06% shorts indicating high bearish pressure over the price in the last 24 hours.
Conclusion
Monero open interest also saw a sharp decline after peaking on 28 June, dropping from $33.55 million to $24.51 million, indicating a rise in the bearish sentiment of the market. Technical indicators suggest that bears have started to enter the market but traders should wait for proper confirmation before looking for bids.
Technical levels
Major support: $160 and $148.5
Major resistance: $170 and $188
Disclaimer
The views and opinions stated by the author, or any people named in this article, are for informational purposes only. They do not establish financial, investment, or other advice. Investing in or trading crypto assets comes with a risk of financial loss.
 thecoinrepublic.com
