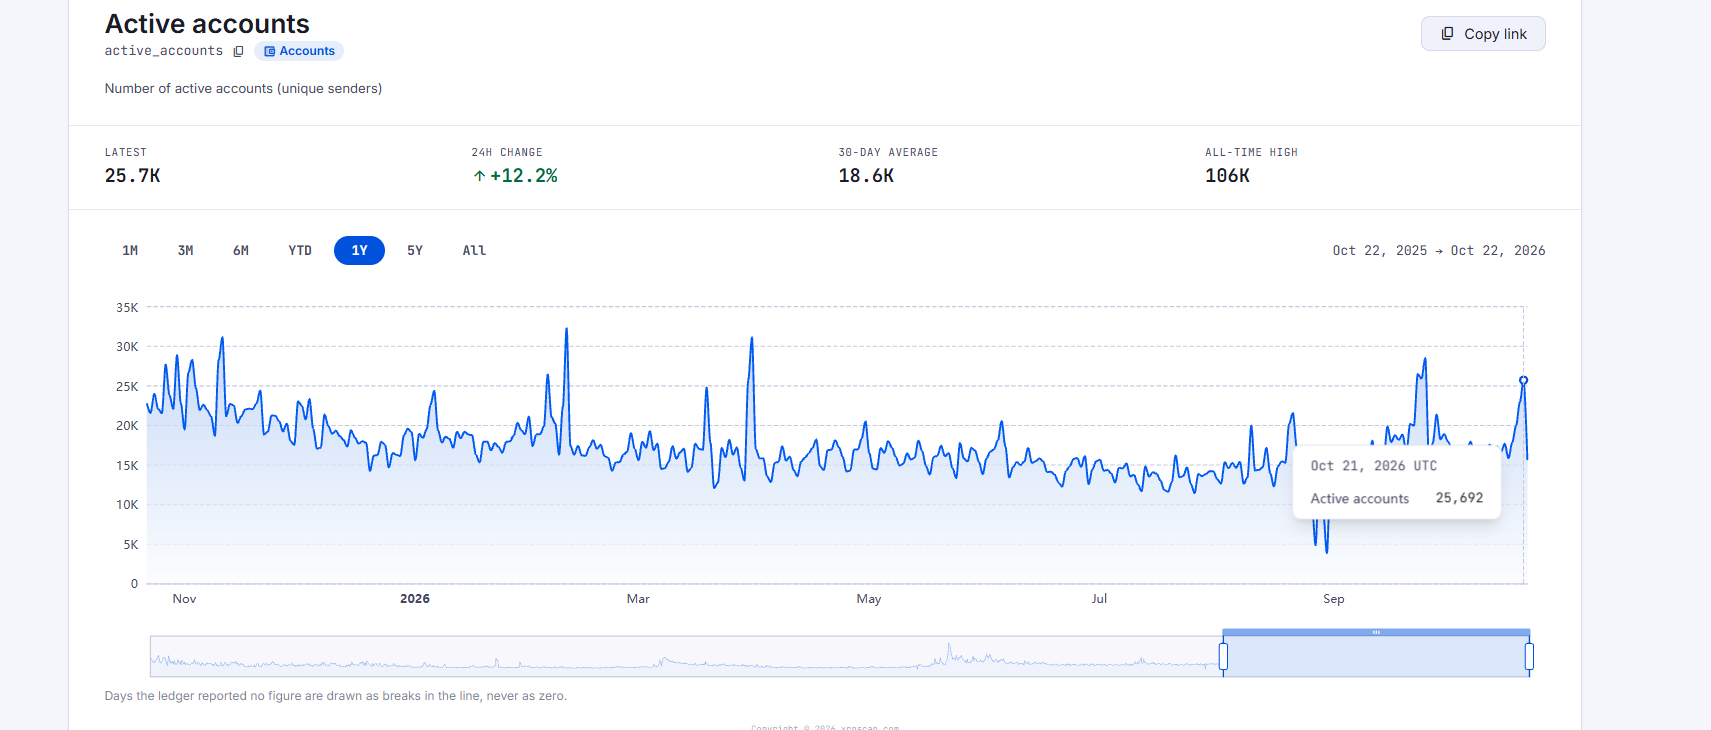
Other numbers support the picture. Transactions rose 55.9% to 3.5M, and successful transactions grew 67.8% to 2.9M. Transactions per ledger climbed 61.5% to 179.34, which indicates the ledger is handling more load. $XRP burned as fees went up 20% to 747.6 $XRP. More activity means more fees are destroyed, which slightly reduces supply.
Not every metric is positive. Payments fell 4.4% to 741.9K, and payment volume dropped 49.6% to 350.9M $XRP. Active users, a separate measure, fell 50% to 85.2K. This indicates the added activity is not necessarily coming from large payments. It may also come from smaller transactions, token activity, or bot-like behavior. The all-time high for active accounts is 106K, so the network is still far from its peak.
What the Price Chart Says
$XRP trades near $1.33, after a daily range between $1.32 and $1.37. The price sits just below a key long-term average near $1.37 to $1.40, which has acted as resistance. Support is around $1.25, where the price bounced earlier this month.
The RSI is below the midpoint, which indicates weak momentum for now. Volume has also been low in recent weeks. If account activity remains high for several days, it may signal real growth.
A move above $1.40 would be the first sign that price is following the network data. A drop below $1.25 would weaken the outlook. For now, the $XRP Ledger is busier, but the price has not reacted yet.

 u.today