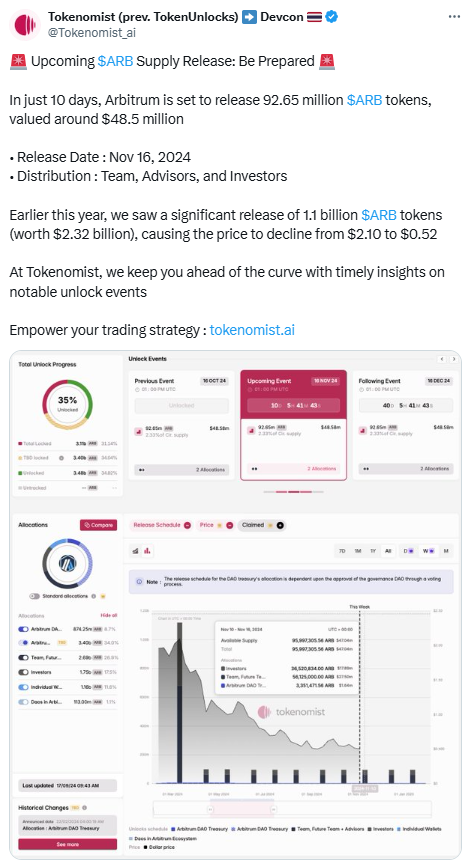
Current Price Movements and Key Support Levels
As at press time, $ARB is trading at $0.5179, reflecting a daily gain of 7.57%. The token has rebounded from a recent low of around $0.481, reaching a high near $0.53 before a minor pullback. This suggests an overall bullish sentiment, but challenges remain.![]()
In terms of support, the first key level is $0.49, where the price has recently bounced multiple times. Another important support is $0.48, which has acted as a stronger floor, stabilizing the token before its recent upward move. If the price revisits these levels, they could provide support, especially with the added selling pressure from the unlock.
Resistance Levels to Watch
$ARB is now testing resistance at $0.52. Breaking above this level could confirm a continued upward trend. This level has previously acted as a ceiling, so it’s an important threshold to watch.
Above $0.52, the $0.53 level represents another key resistance zone, marking the recent peak. A decisive break above this price could signal further upside potential, potentially mitigating some of the selling pressure from the unlock.
Technical Indicators Point to Possible Market Trends
$ARB/USD 4-hour price chart, Source: Trading view
The 4-hour RSI for $ARB is currently at 59.52, indicating a neutral stance. It’s approaching overbought territory but not quite there yet. The 4-hour MACD is trading above the signal line, suggesting some bullish momentum, though it remains relatively weak. If the MACD continues to rise, it could attract more buyers.
Disclaimer: The information presented in this article is for informational and educational purposes only. The article does not constitute financial advice or advice of any kind. Coin Edition is not responsible for any losses incurred as a result of the utilization of content, products, or services mentioned. Readers are advised to exercise caution before taking any action related to the company.

 coinedition.com