Litecoin (LTC) has posted daily gains of almost 20% on Nov. 9, the highest levels for LTC/USD since May 2021, amid a wider cryptocurrency market rally that analysts attribute to inflation fears.
#Bitcoin, #Ether hit records, exceeding Oct high, amid broad rally in cryptocurrencies. Low real yields, need for inflation hedges are shaping markets. pic.twitter.com/xN0Athssng
— Holger Zschaepitz (@Schuldensuehner) November 9, 2021
The 14th-largest digital asset rose by a little over 25% in three days pushing its price to almost $250 on Coinbase. Meanwhile, the total value of cryptocurrencies reached nearly $3 trillion, the highest level ever.
Bitcoin influence
Litecoin's ongoing price rally drew inspirations from similar upside moves across the top digital asset brass, data from Cointelegraph Markets Pro shows.
For instance, Bitcoin (BTC), the world's leading cryptocurrency by market cap, rallied to a new record high Tuesday above $68,500. Ether (ETH) also logged an all-time high above $4,840.
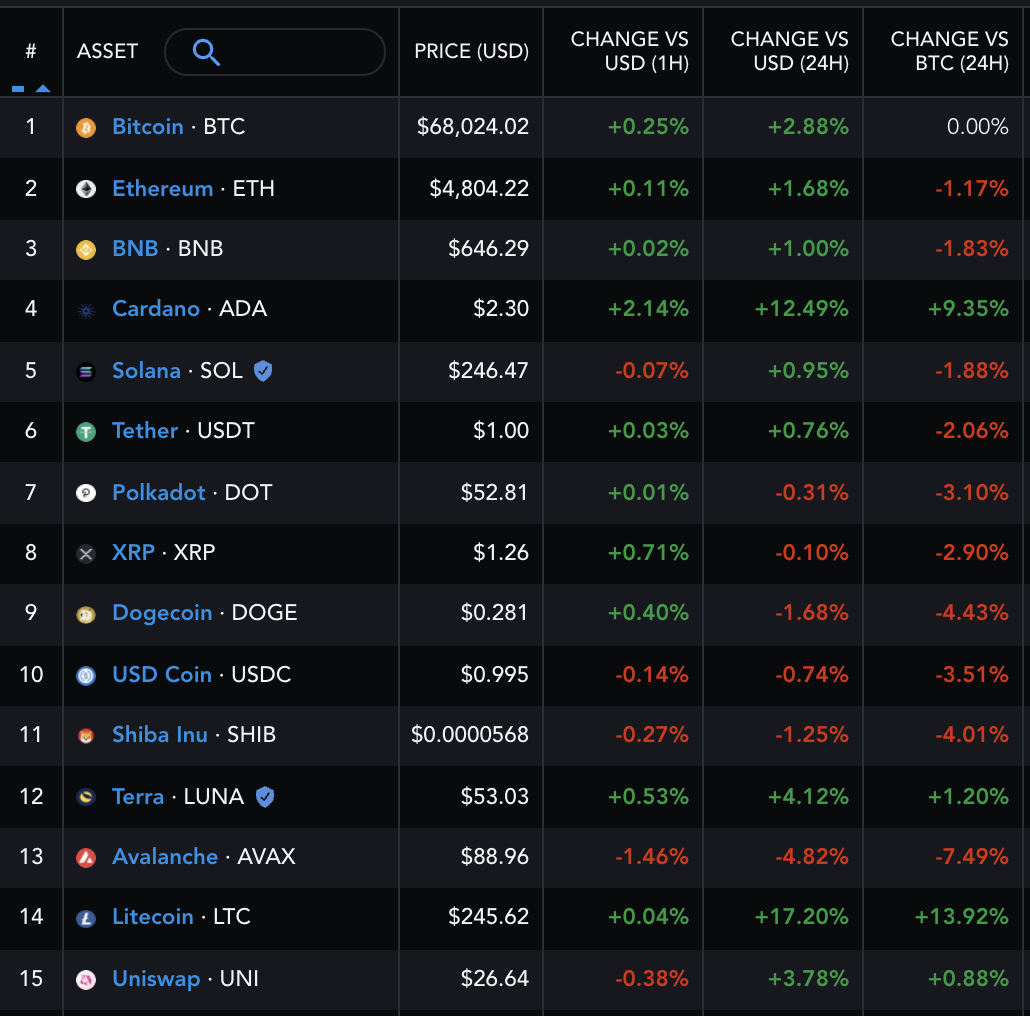
Nonetheless, only a few top alternative cryptocurrencies (altcoins) fared better against Bitcoin in the previous 24 hours, including Litecoin. Data provided by Messari showed that the hugely-traded LTC/BTC instrument surged almost 14%, indicating a rise in capital migration from Bitcoin to Litecoin markets.
The pair's technical outlook suggested further gains ahead, based on a classic bullish reversal pattern called a Falling Wedge.
Falling Wedges begin wide at the top but start contracting as the price moves lower. A bullish confirmation comes when the price breaks above the Wedge's upper trendline. Analysts typically interpret the breakout as a signal to a rally towards the profit target that sits at length equal to the Wedge's maximum height.
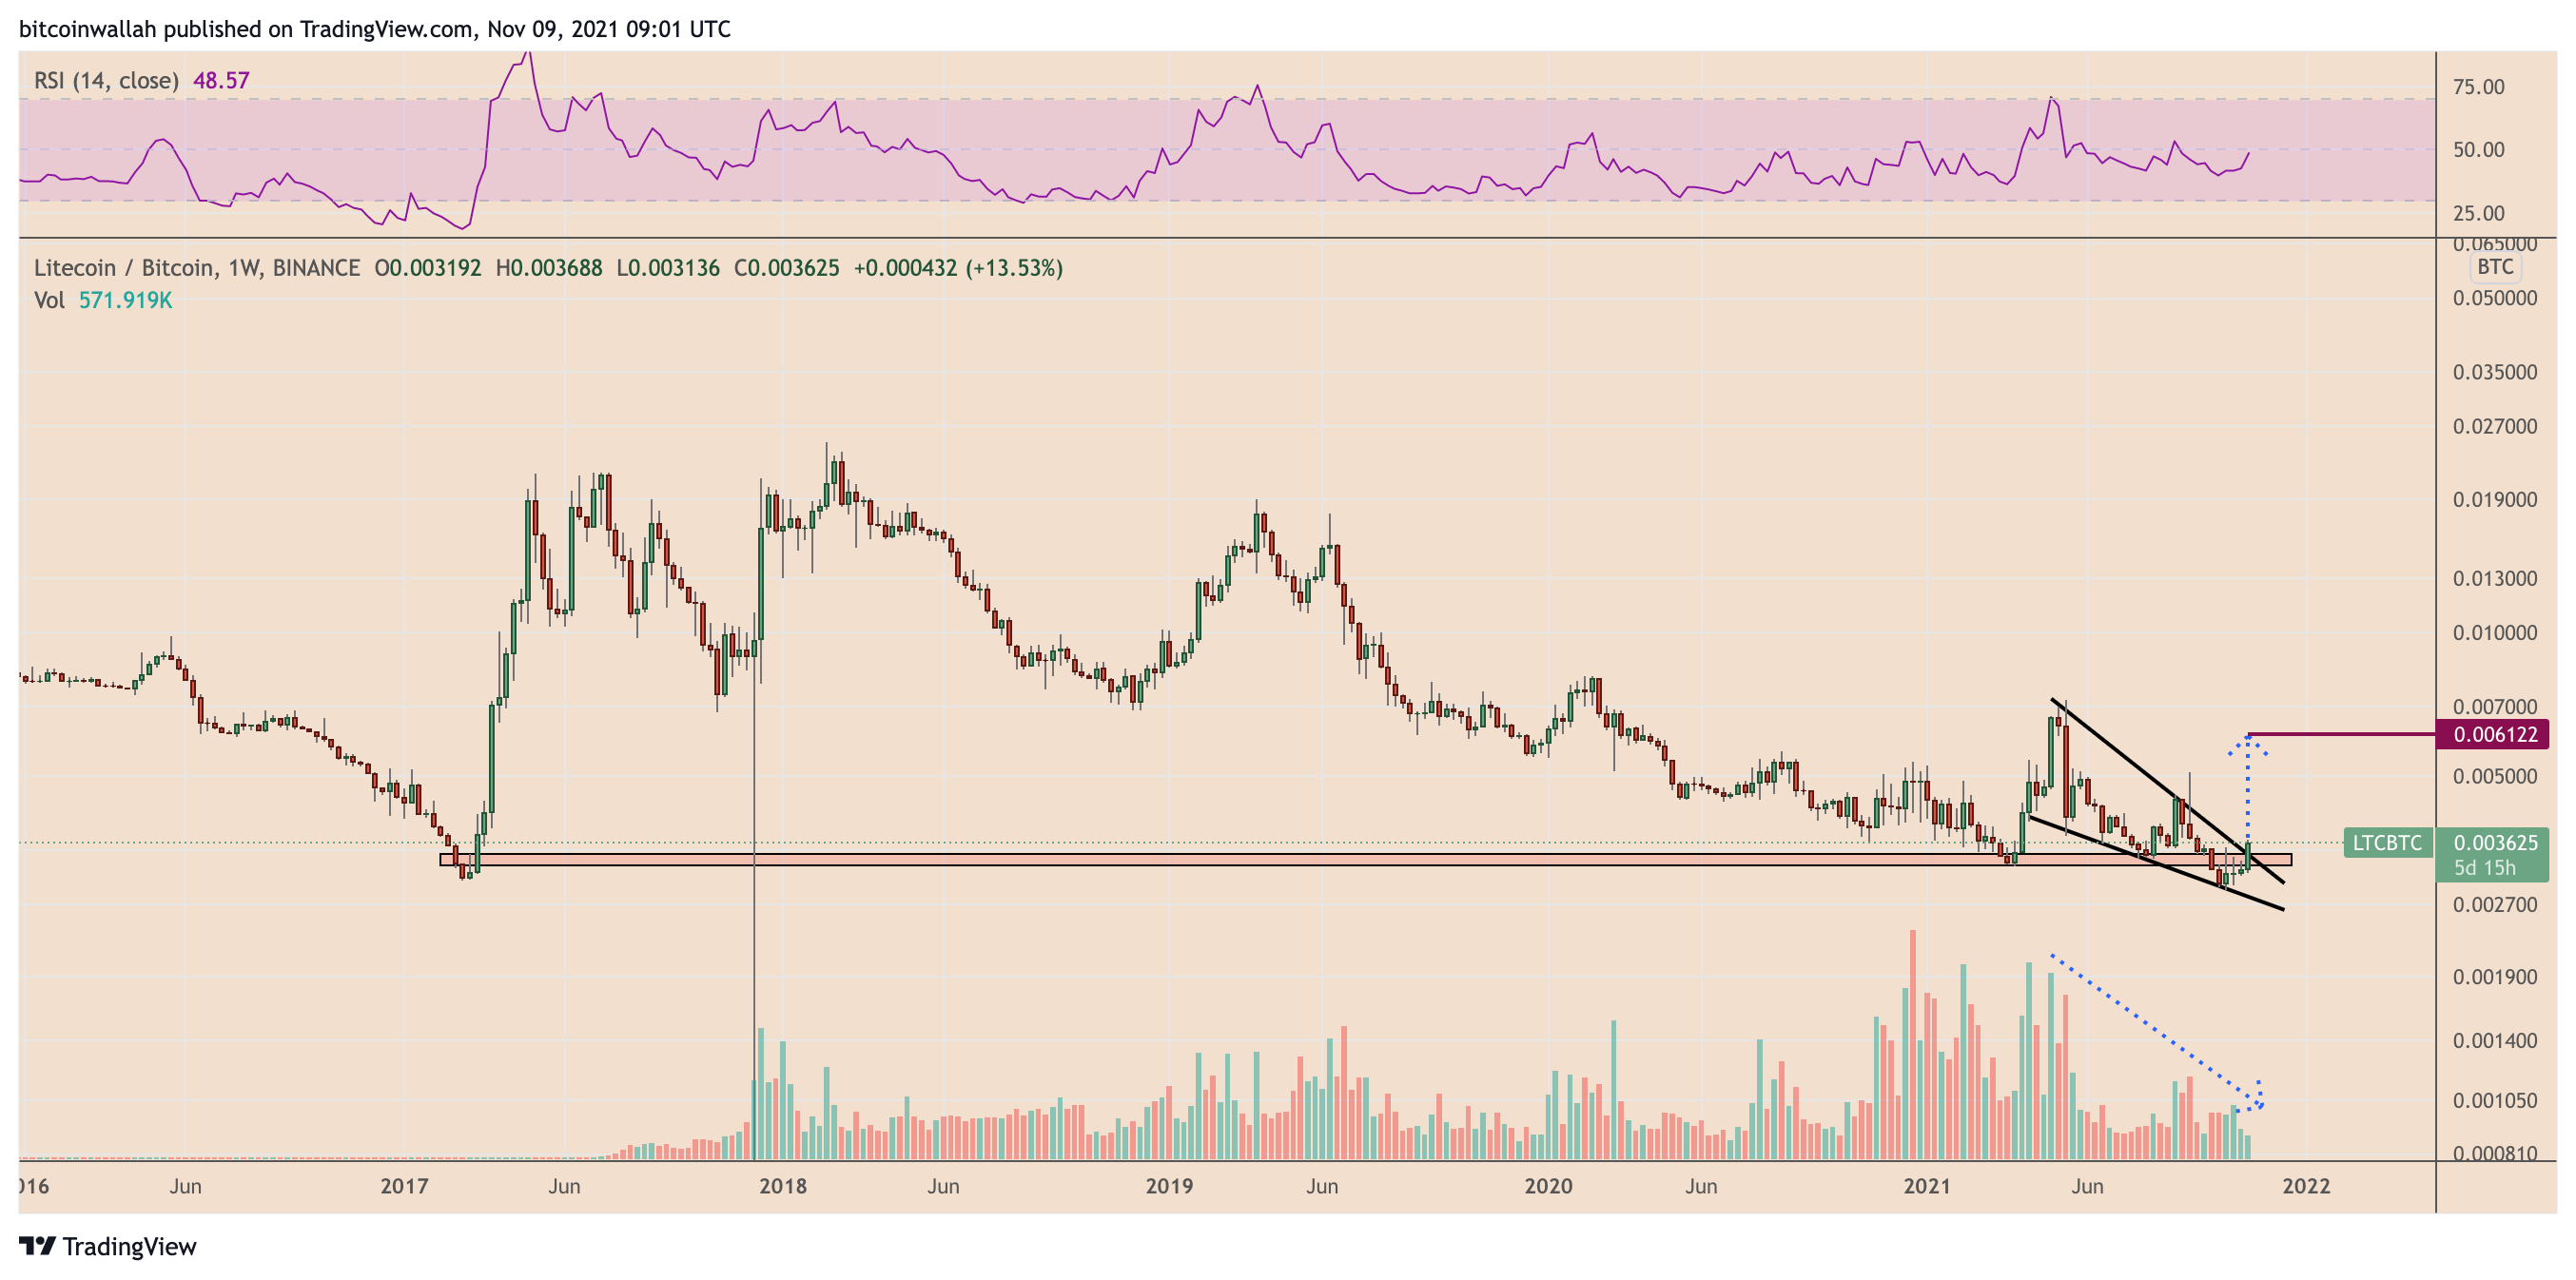
The latest Litecoin gains had its price break above its Falling Wedge's upper trendline, staging prospects of additional upside.
In doing so, the profit target comes to be around 0.006122 BTC. On the flip side, the Litecoin chart detected a bearish divergence between its rising prices and falling volumes in the last three weeks, underscoring that the Falling Wedge breakout move may grow weaker.
Another Litecoin wedge, but bearish
The Litecoin price, in the U.S. dollar terms, has rallied by more than 150% after bottoming out near $103 on July 20. But the "silver to Bitcoin's gold" cryptocurrency's massive upside move has also triggered a bearish reversal outlook, indicating that its ascent is due for a pause.
Related: Litecoin transactions near an all-time high after gaining ground in consumer finance
Dubbed Rising Wedge, the pattern is the complete opposite of the Falling Wedge. It begins wider at the bottom but starts contracting as the price rises. A bearish confirmation comes when the price breaks below the lower trendline and then targets levels at length equal to the Wedge's height.
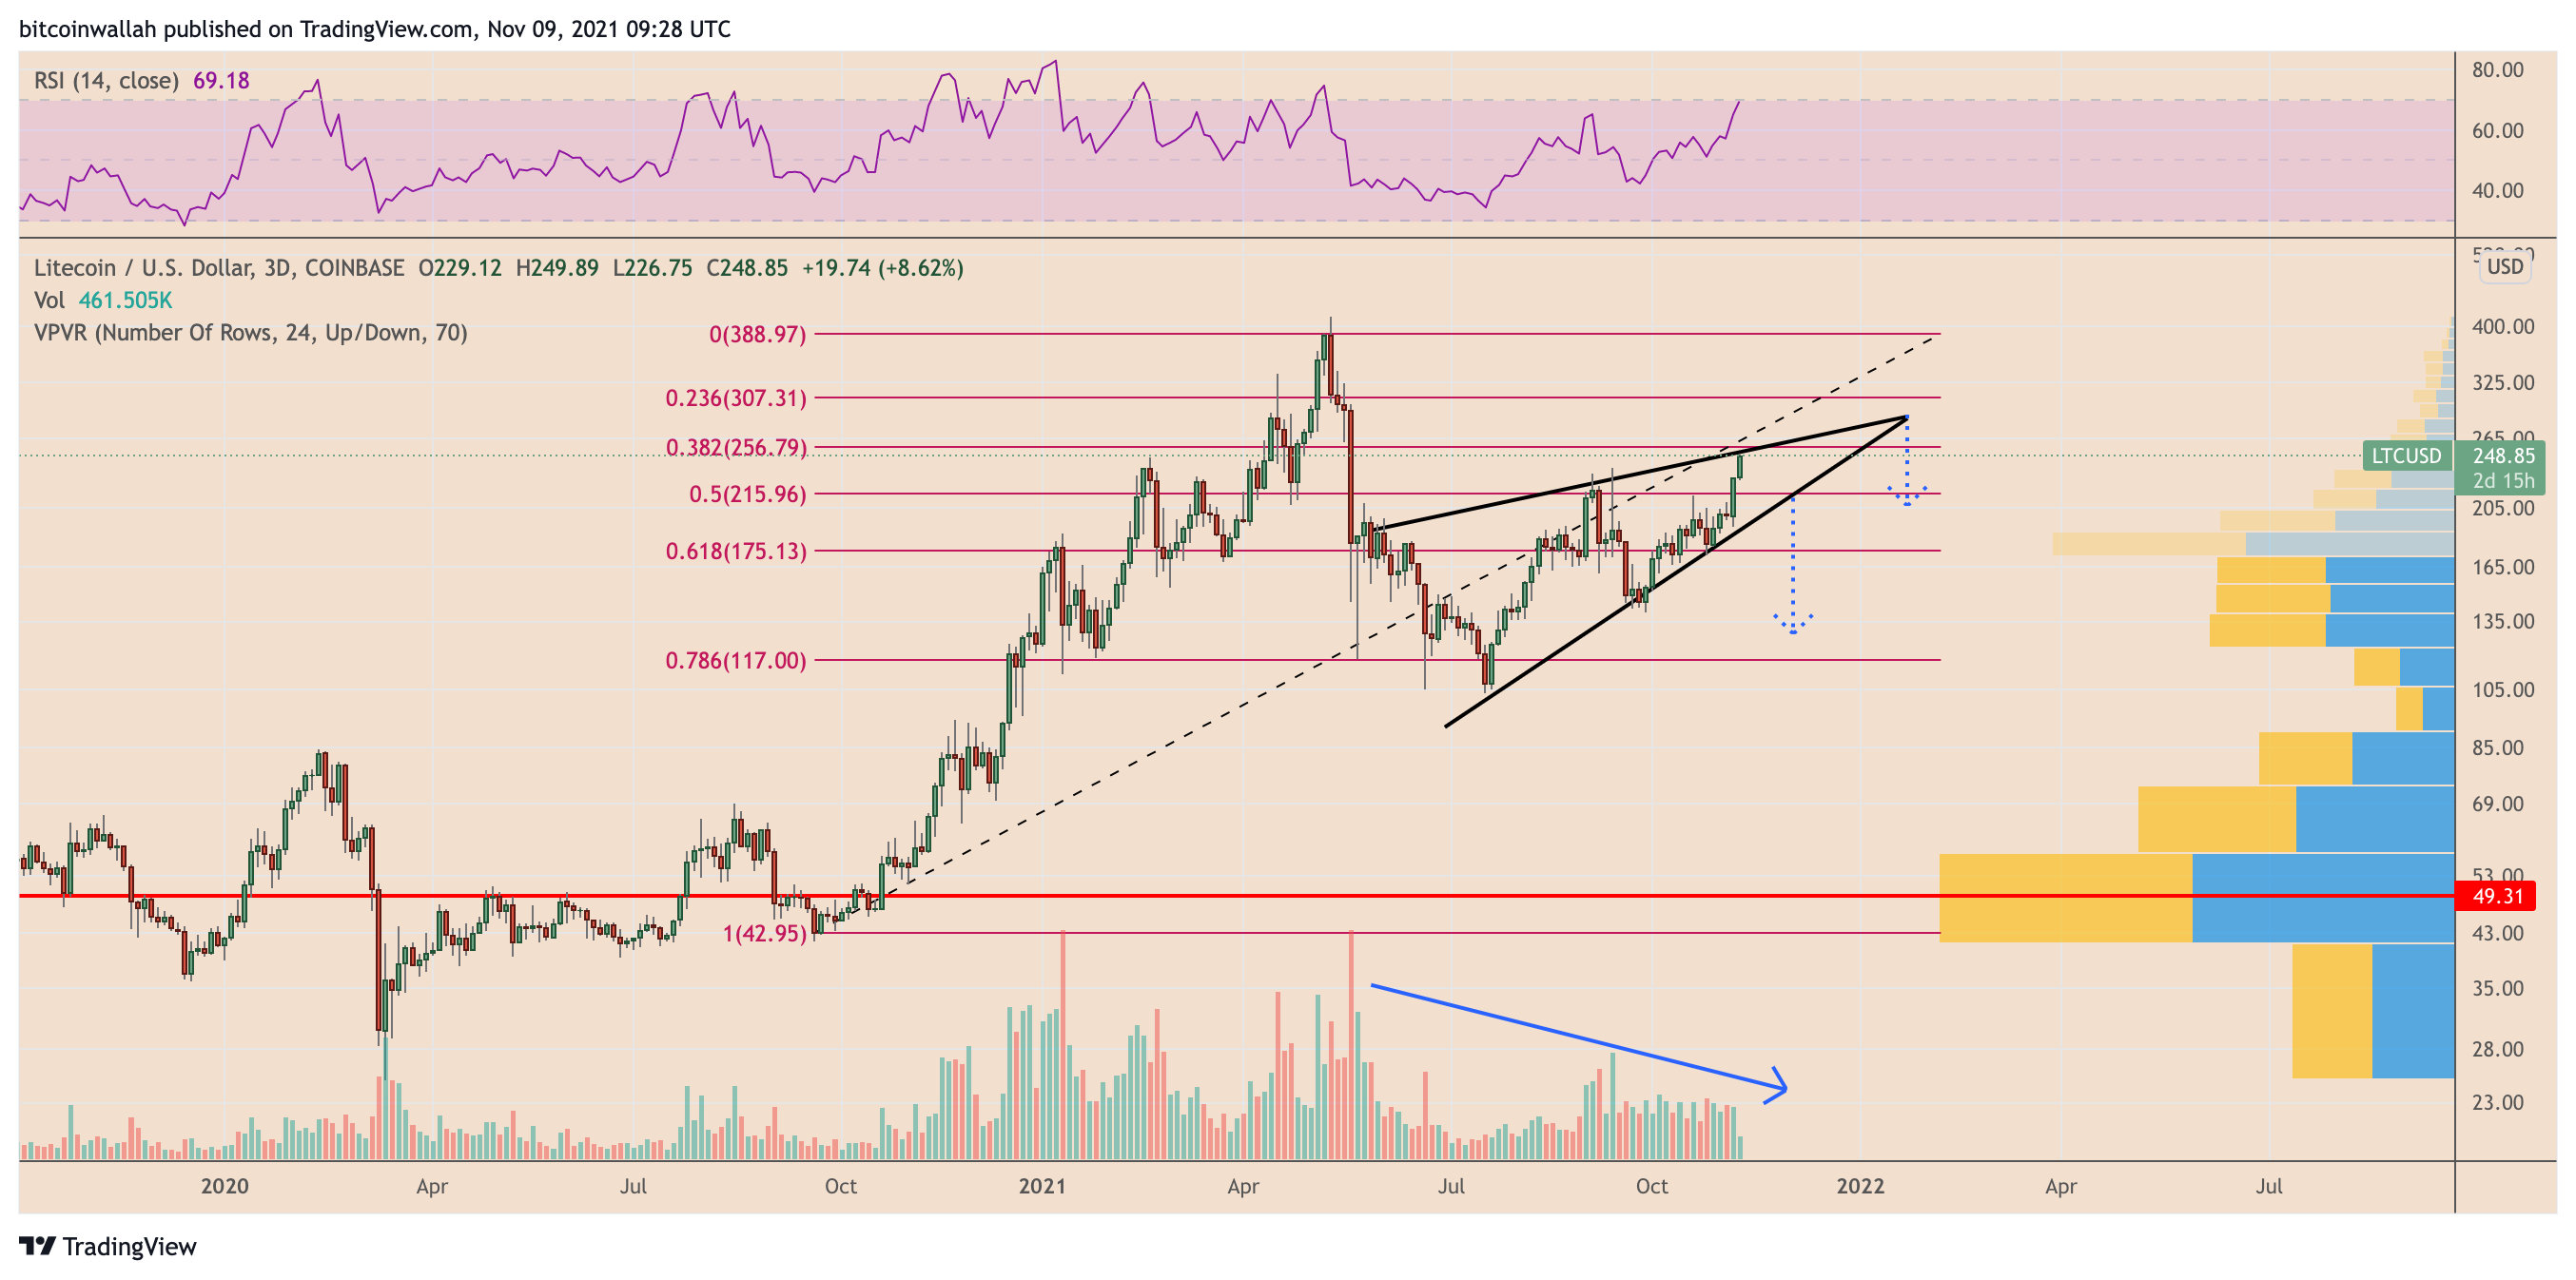
Depending on the level from where Litecoin initiates its negative breakout, the Wedge target may shift from anywhere between $117 and $21.
Conversely, a decisive breakout above $250 would risk invalidating the Rising Wedge pattern, setting LTC en route to test $300 as its next price target.
The views and opinions expressed here are solely those of the author and do not necessarily reflect the views of Cointelegraph.com. Every investment and trading move involves risk, you should conduct your own research when making a decision.