- INJ’s trading volume spiked 508% from $2.5M to $15.3M in 3 days.
- Injective’s new protocol upgrade — Avalon — is expected to commence on June 1.
Cryptocurrency Injective (INJ) shoots up to the top, capturing investors’ attention with its three consecutive daily green candles laid this week. Significantly, INJ’s 24-hour price surge on Monday bolstered its spot on the top gainers’ charts.
Remarkably, the trading volumes of INJ highlight a positive landscape. In the past 3 days, Injective trading recorded astounding surges in volumes. On May 27, daily trading volume was at $2,520,236 and it rose to $15,342,611 on May 29 after surging by 508%.
In spot markets, INJ volumes observed a 671% surge — from $528K to $4.07M — and in derivatives markets, a 465% surge — from $1.9M to $11.2M. Just before the notable spike, the project initiated a weekly burn of 5,689,124 INJ. Furthermore, this Cosmos IBC-enabled blockchain has lined up a protocol upgrade, Avalon, for this week. Currently, it stands as a proposal with 99.74% approval.
The Avalon Mainnet Upgrade has been initiated to bring you the most powerful version of Injective to date.
— Injective 🥷 (@Injective_) May 28, 2023
The gov proposal is active and the upgrade scheduled to occur later this week.
🚀 L1 scalability optimizations
🚀 Sub-Second Block Times
🚀 PoS delegation revamp
To note, the Avalon upgrade will facilitate the revamp of the Injective Chain — from v1.10 to v1.11. Once the proposal is approved, the migration is likely to occur on June 1 at 14:00 UTC.
Injective Still in Bearish Zone
Injective (INJ) has been one of the top cryptocurrencies that hold maximum year-to-date (YTD) gains — 484%. INJ jumped from $1.27 at the start of 2023 to $9.8 in April and currently hovering between $7.5 and $8. Despite this, INJ is under the spell of the bears.
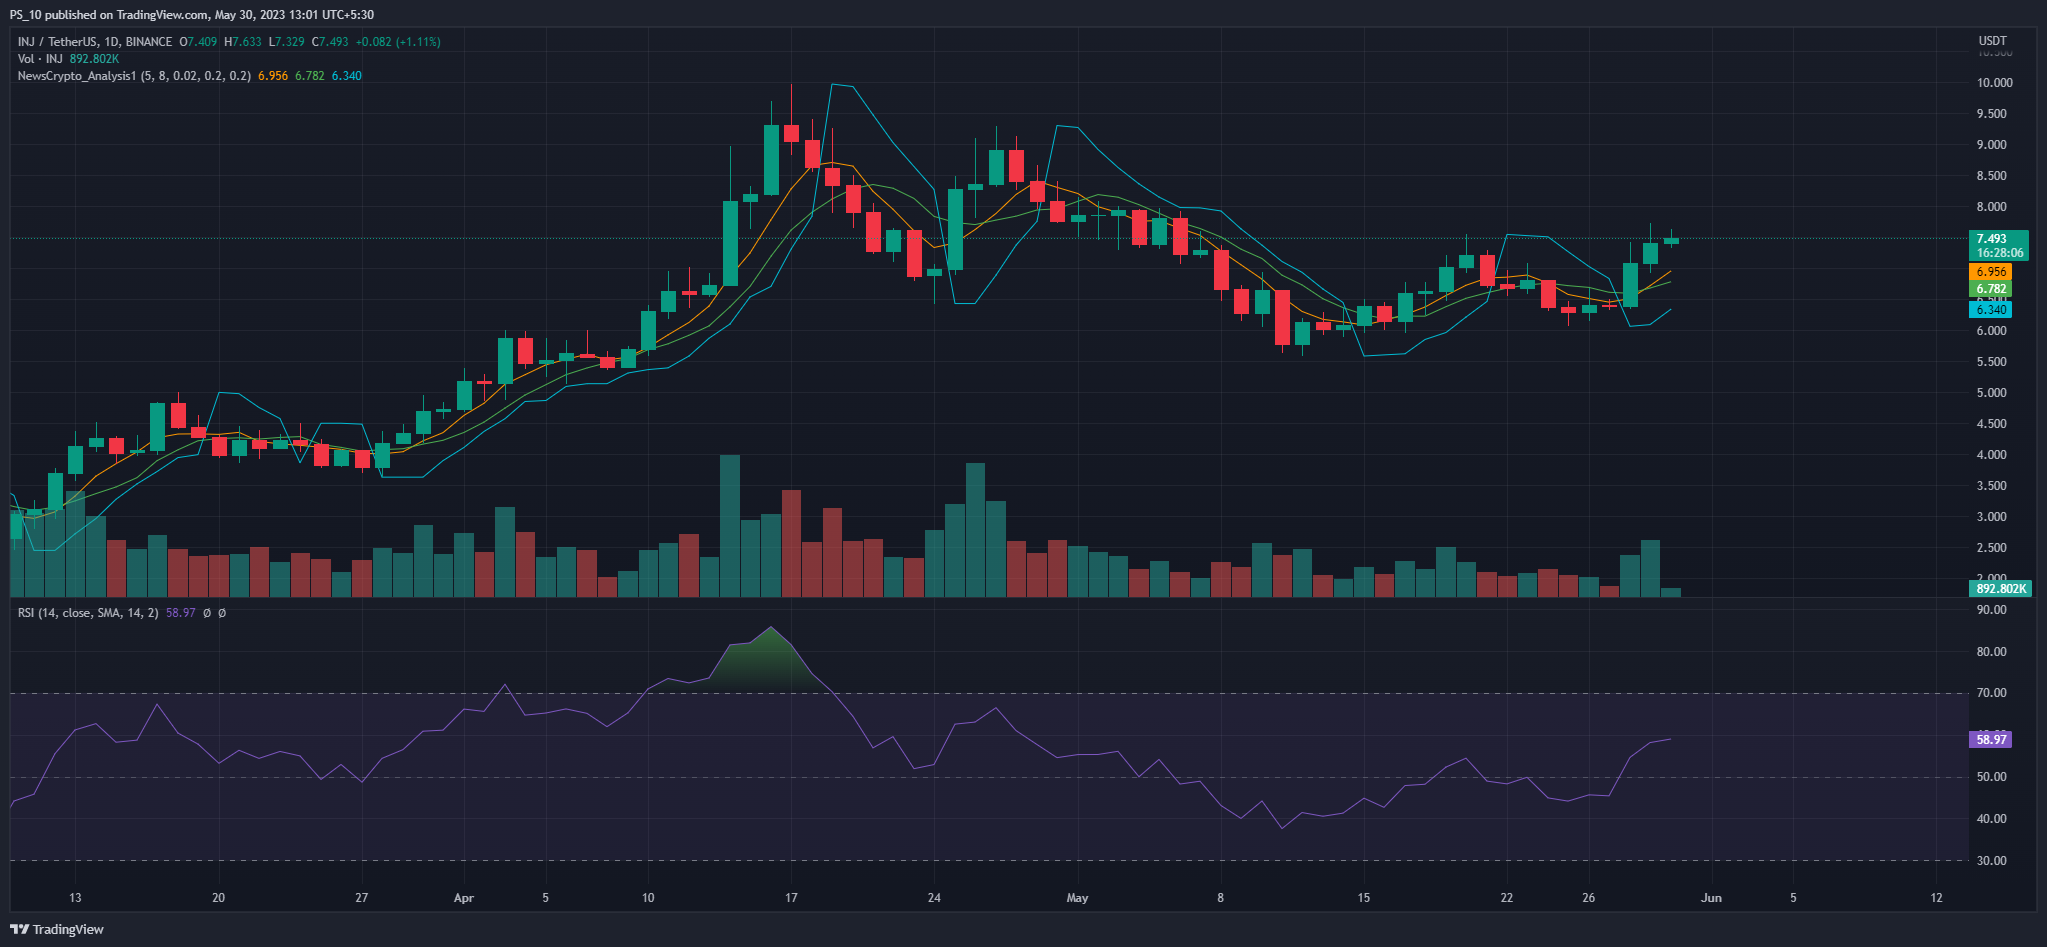
According to the above chart, the negative MA crossover — the 8-day moving average overtaking 5-day moving average — confirms the ongoing bearish trend. On the other hand, the parabolic SAR hovering below the current price action also points to its bearish state.
Recommended For You
Hottest Coins Based on Community Votes Revealed
Disclaimer: The views expressed in this article are for informational purposes only and do not necessarily reflect the opinions of TheNewsCrypto. The content provided should not be considered investment advice.