BeInCrypto breaks down the five biggest altcoin movers and shakers from the previous week. Will their momentum continue this week?
The five altcoins that increased the most last week were:
- Algorand (ALGO) : 50.81%
- Elrond (EGLD) : 48%
- Harmony (ONE): 42%
- Near Protocol (NEAR): 28.5%
- Tezos (XTZ): 23.9%
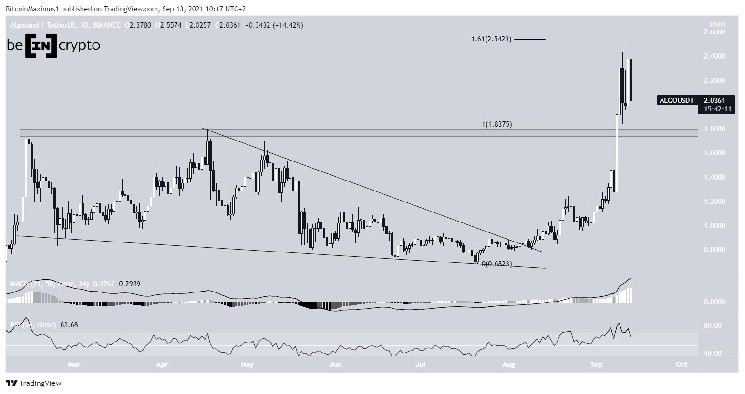
ALGO
ALGO has been increasing since breaking out from a descending wedge on Aug 5. The upward move accelerated following a dip on Sept 7.
ALGO broke out from the $1.75 resistance area the next day and proceeded to reach a high of $2.56 on Sept 13. The high was made right at the 1.61 external Fib retracement resistance level.
Currently, ALGO is in the process of creating a bearish engulfing candlestick. While the MACD is still increasing, the RSI has generated some bearish divergence.
The $1.75 area is now expected to act as support.
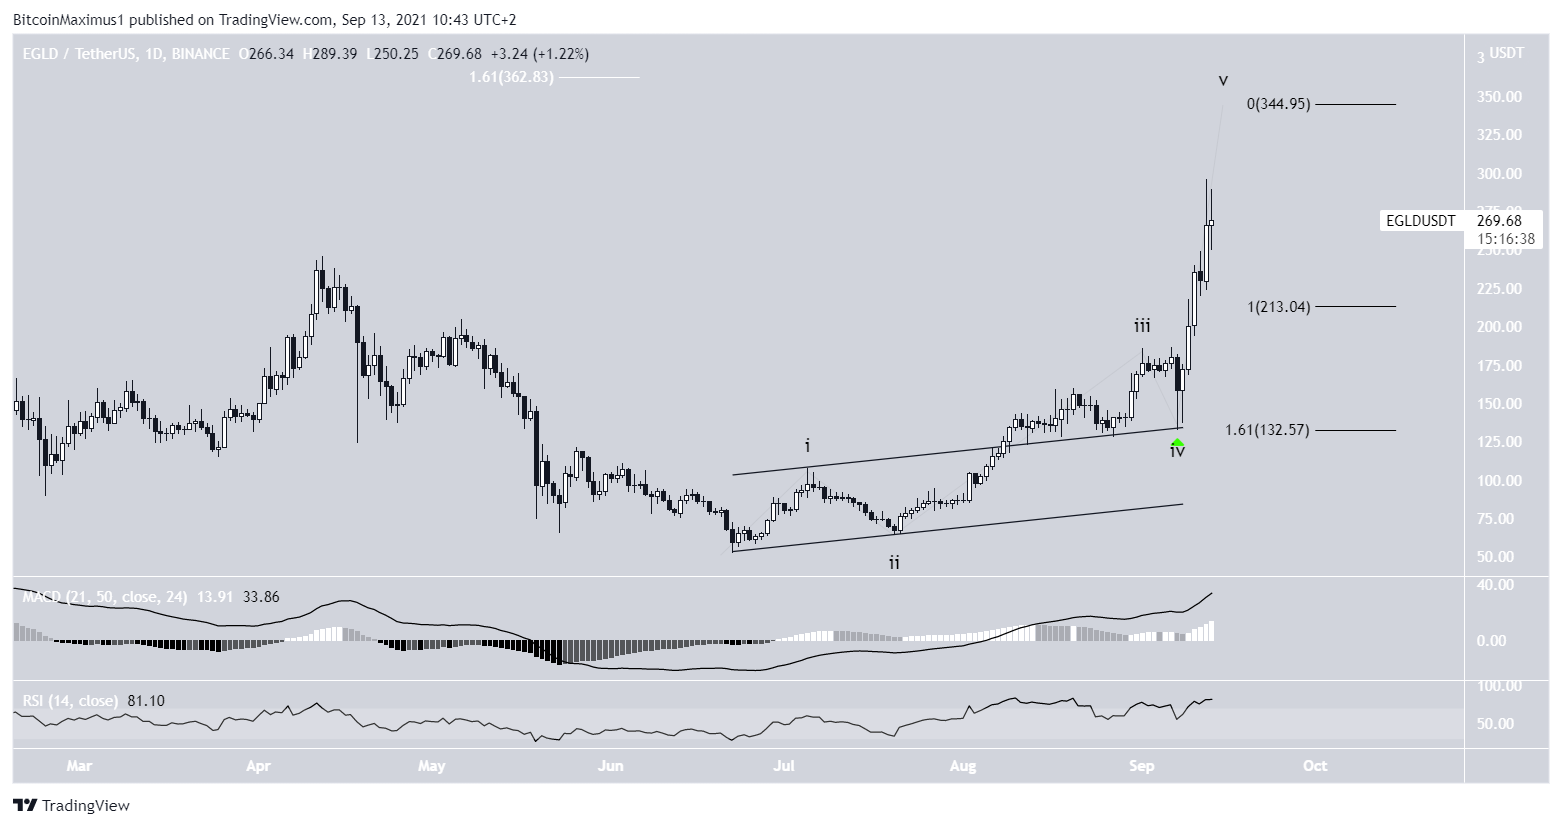
EGLD
EGLD has been increasing since June 22. It broke out from an ascending parallel channel on Aug 9 and returned to validate it as support on Sept 7, successfully completing a fourth wave pullback.
It has been moving upwards since and reached a new all-time high price of $295.80 on Sept 12.
If the movement is a five-wave bullish impulse, a likely level for the top of the entire upward move would be between $345-$363. This target range is made up of the 1.61 external Fib retracement of the most recent drop (white) and the 1.61 length of waves 1-3 (black).
Neither the MACD nor the RSI is showing any weakness.
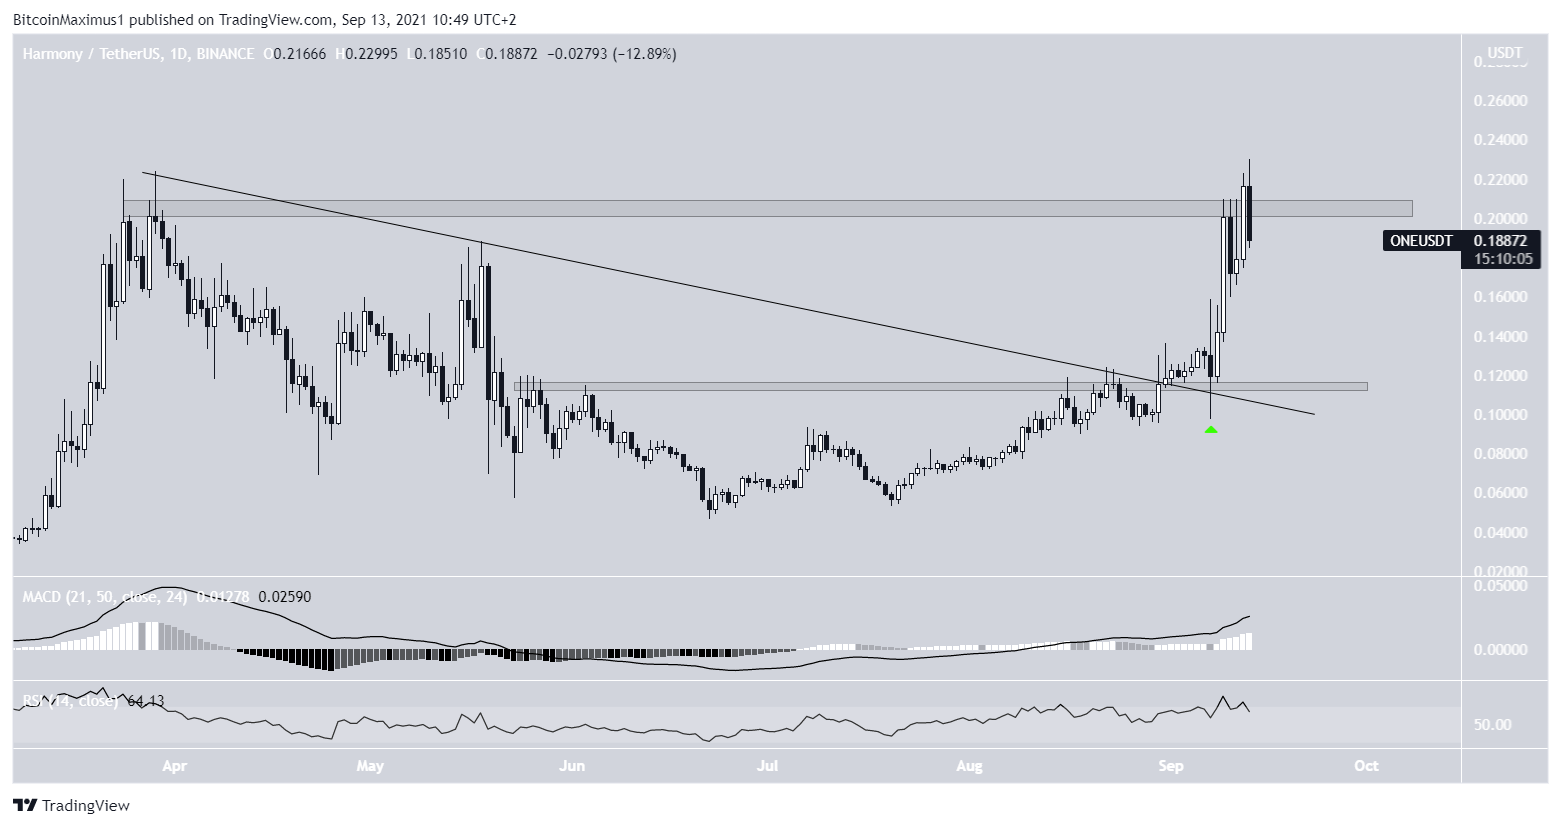
ONE
ONE has been increasing since breaking out from a descending resistance line and validating it as support on Sept 7. The drop also validated the $0.115 area as support.
On Sept 13, ONE reached a new all-time high price of $0.23.
However, it failed to break out and is in the process of falling back below the $0.205 resistance area. In order for the upward trend to continue, ONE has to reclaim this area.
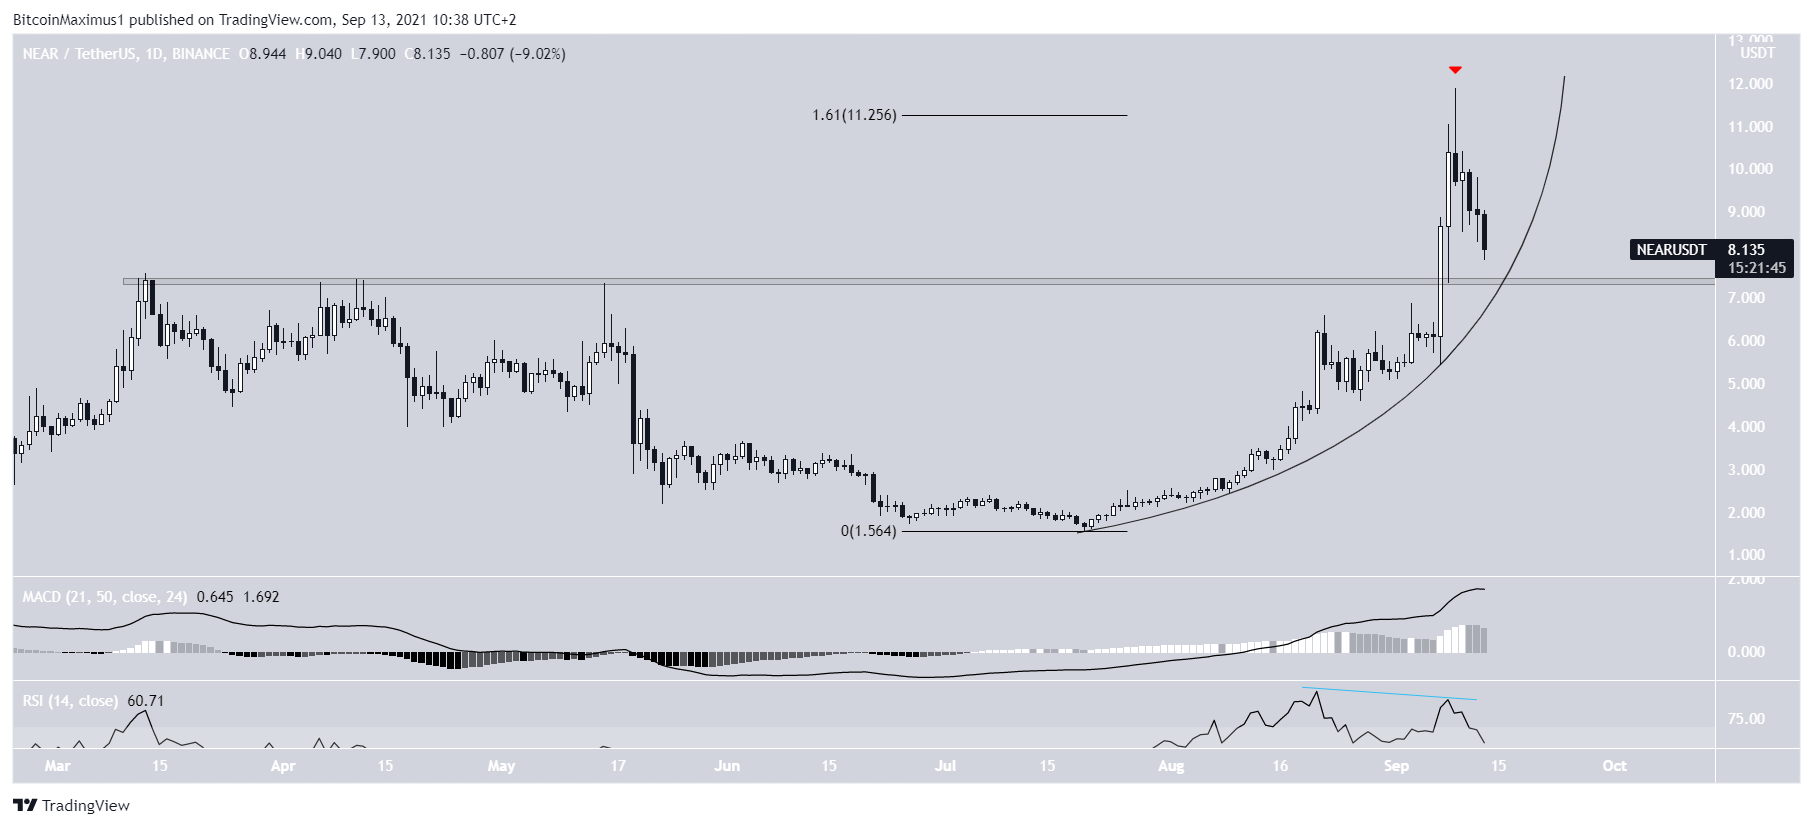
NEAR
NEAR has been increasing alongside a parabolic ascending support line since July 20. On Sept 9, it reached a new all-time high price of $11.88. However, it created a shooting star candlestick the same day and has been decreasing since.
The decrease was preceded by a bearish divergence in the RSI.
Despite the drop, the parabolic ascending support line is still intact. Furthermore, it coincides with the $7.50 horizontal area, which previously acted as resistance and is now expected to act as support.
Therefore, as long as NEAR is trading above these two support levels, the bullish structure remains intact.
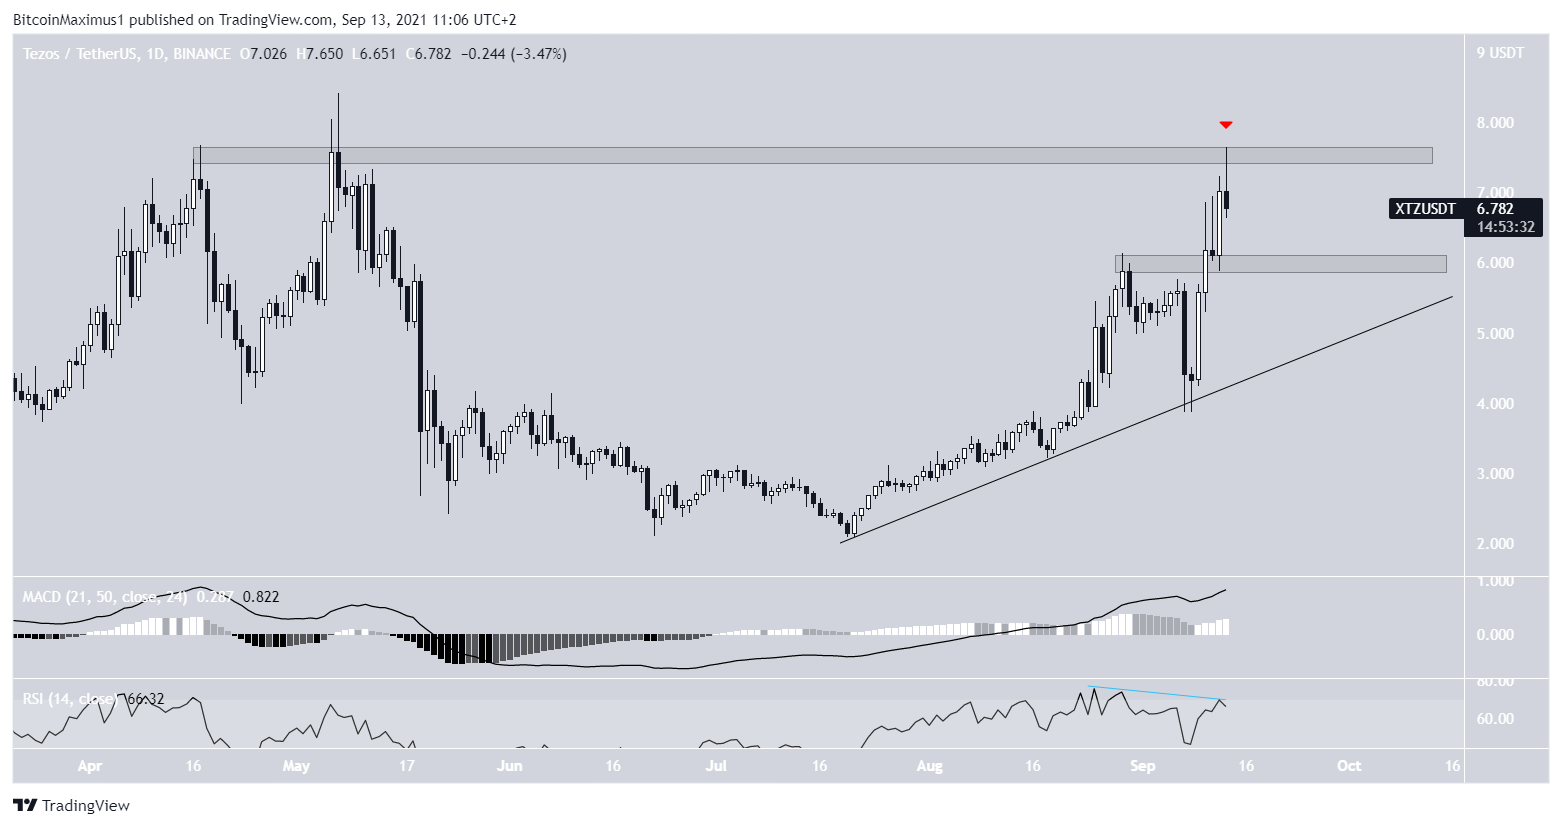
XTZ
XTZ has been increasing alongside an ascending support line since July 20 and began to accelerate on Sept 9.
On Sept 13, XTZ managed to reach a high of $7.65. However, it was rejected immediately and created a long upper wick. The decrease was preceded by a bearish divergence in the RSI.
If a downward move transpires, the $6 area is expected to act as support.