Litecoin hasn't been dominating the headlines such as Bitcoin, but quietly it has gained almost 400% during this bull market of 2019. It has attempted to breach the $100 level twice now, can it succeed the third time and turn resistance into support?
Highlights:
- $100 strong resistance level
- Momentum holding above 50 on RSI
- Possible retracement if $100 fails again.
Taking a look at the daily we notice that Litecoin has been slowly ramping its way up to the $100 level. Its first attempt at breaking the $100 resistance was back at the start of April, but it did not manage to get a daily close above it. Price fell back down to the support line that formed from this past few month’s uptrend. Its next attempt was in early May when it managed to pass the $100 resistance, but once again was denied and fell back down to the support line.
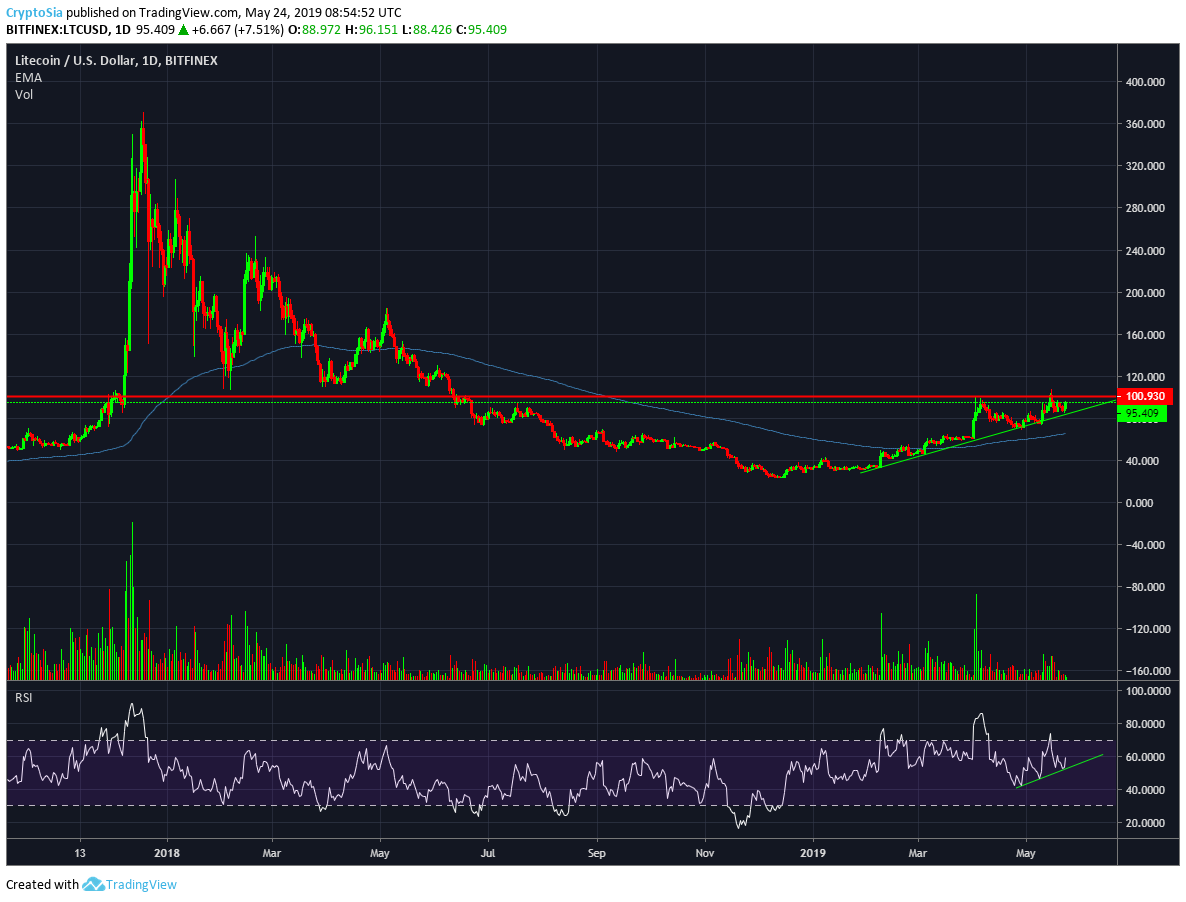
LTC/USD chart provided by Tradingview
As we now approach the $100 resistance again, we will look to indicators to give us a sign of direction. On a hourly chart we can see that LTC has left its retracement phase and entered its impulse phase, with price pushing away from the 200EMA with good volume.
As we know rising price with rising volume is a bullish sign. If we look back to the 10th of May, we can see very similar price action taking place. RSI found support above the 50 line and soon after started its impulsive move, pushing price away from the 200EMA. What followed was a few days of uptrend to a price of $105. If it can continue following this structure, it would get LTC above $100 and onto new highs.
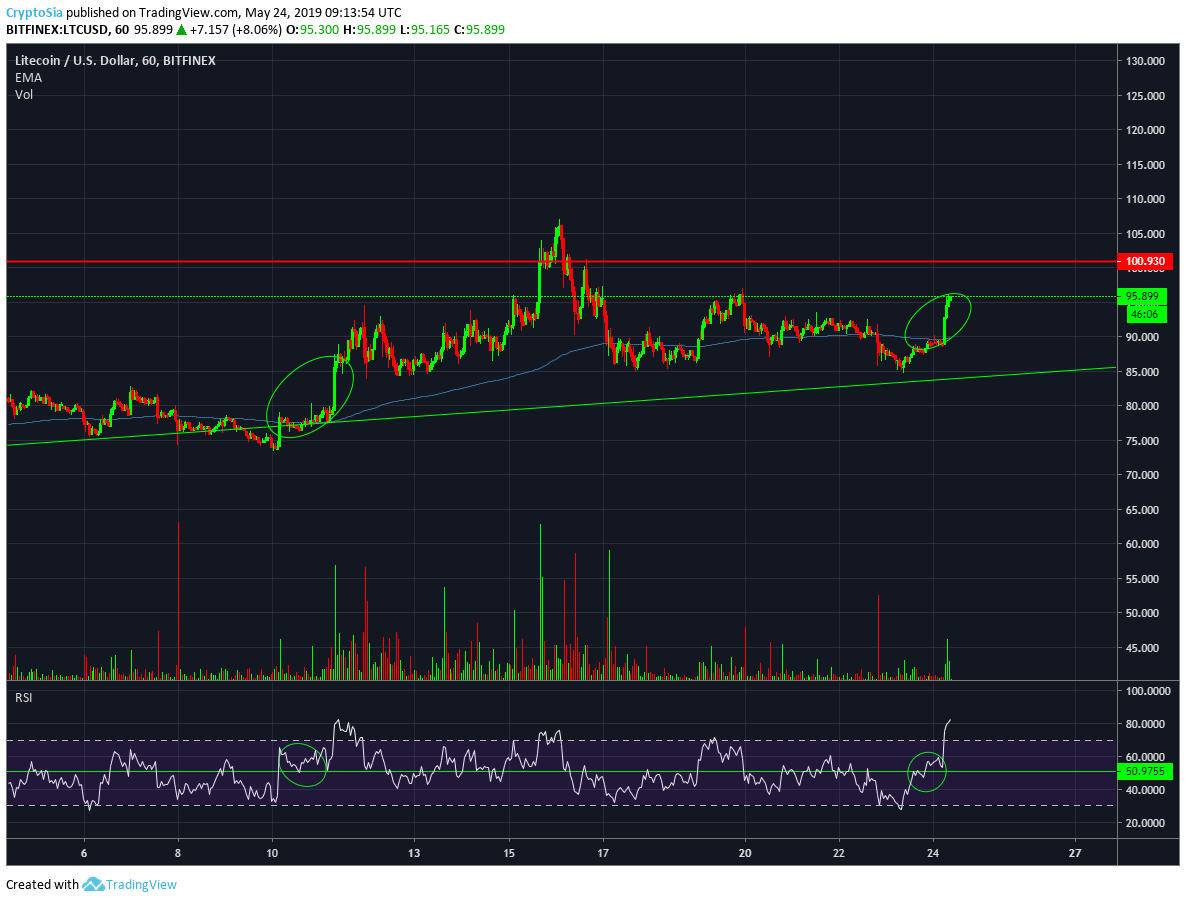
LTC/USD chart provided by Tradingview
What if we get denied again?
Since LTC failed to break $100 twice, it is also a good idea to look at where we can fall to in case we get another deny at resistance. Taking a look again at the daily we see some support levels near the $65 area, which is also currently right on top of the 200EMA. If we also add a fib extension on the chart, we can see that $65 is a perfect 50% retracement level which adds some more confidence is the support line.
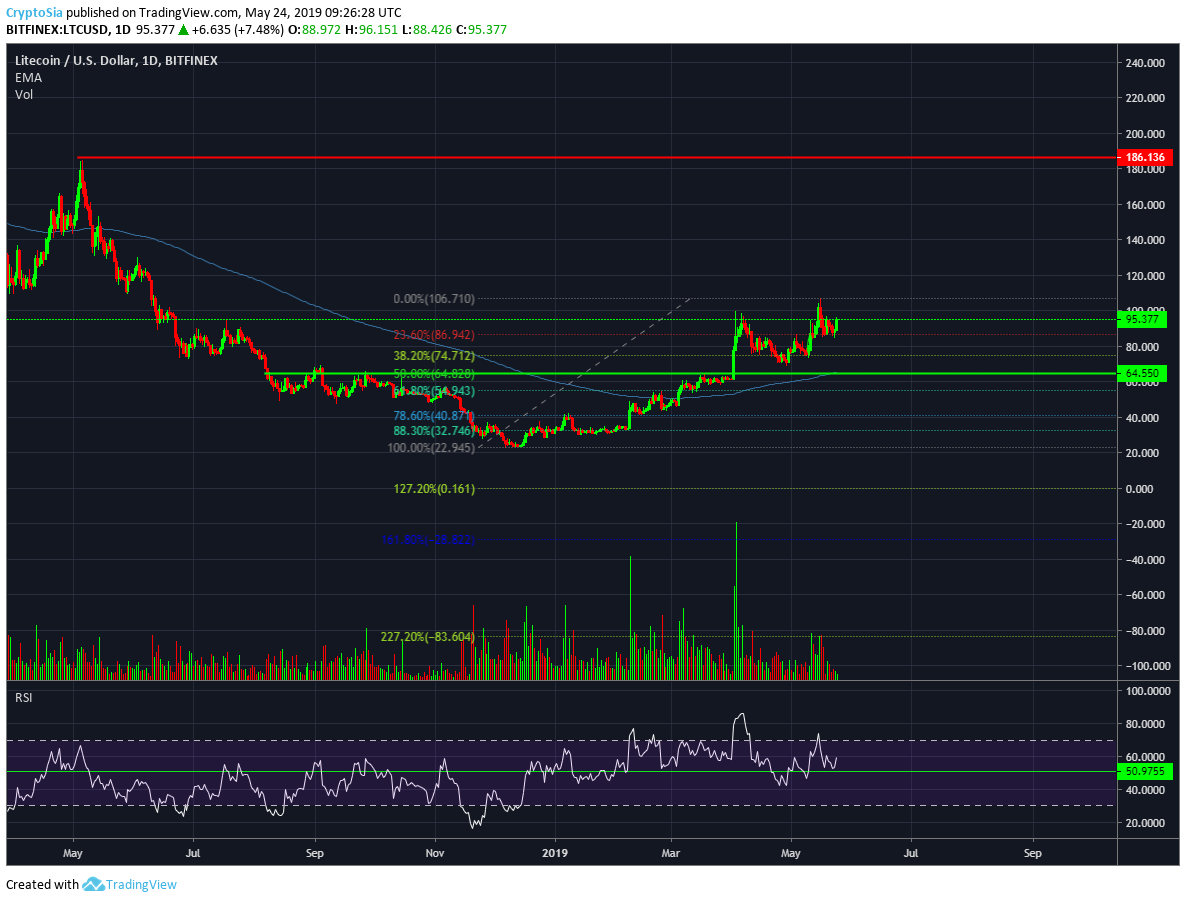
LTC/USD chart provided by Tradingview
Overall things are looking bullish for Litecoin. RSI is still above 50 on the daily, and the fact that this current uptrend only seems to be the ramp for the real bullish action that is on the way, makes Litecoin a very interesting choice to look at.
Can Litecoin finally break to new highs or will $100 resistance prove too strong? Let us know what you think in the comments below!
Disclaimer: Keep in mind this not investment or trading advice, just the opinion of our analysts. As always, do your own research, make your own decisions.