The entire cryptocurrency market is green across the board and the big coins are taking the lead. Stellar was a big favorite in 2017 due to the massive increase in price it achieved rising more than 7000%. This past week XLM has doubled in price with plenty of volume entering. Where will XLM find support after these gains? And can Stellar reach its 2017 high of $0.98?
Highlights:
- Poloniex to offer Stellar Inflation awards
- XLM following BTC structure
- All smaller time frames resistance levels have been hit.
- Can we find support at $0.136
The Poloniex exchange announced on Wednesday that eligible users wil be receiving Steller Inflation Rewards in the near future. Has this news helped with the XLM price increase this past week? Let's take a look at the technicals.
Starting off with the daily we notice that XLM's structure looks almost identical to the structure of BTC and for the moment Stellar is still copying BTC's price action. This does not necessarily mean that it will continue to follow Bitcoin's steps, but we can definitely use it as a guide to see what can possibly happen next.
Open road towards $0.28
We have hit resistance at $0.165 and now cooling down a bit after the sharp incline, but once we clear this zone we have an open road towards $0.286. RSI is currently 75 and still pointing upwards, indicating large volume entering. If RSI can manage to stay near above 70, we can expect price to continue up. On the daily we only see one good support line which is near $0.136, but let's have a look at a smaller time frame to see what support levels are there.
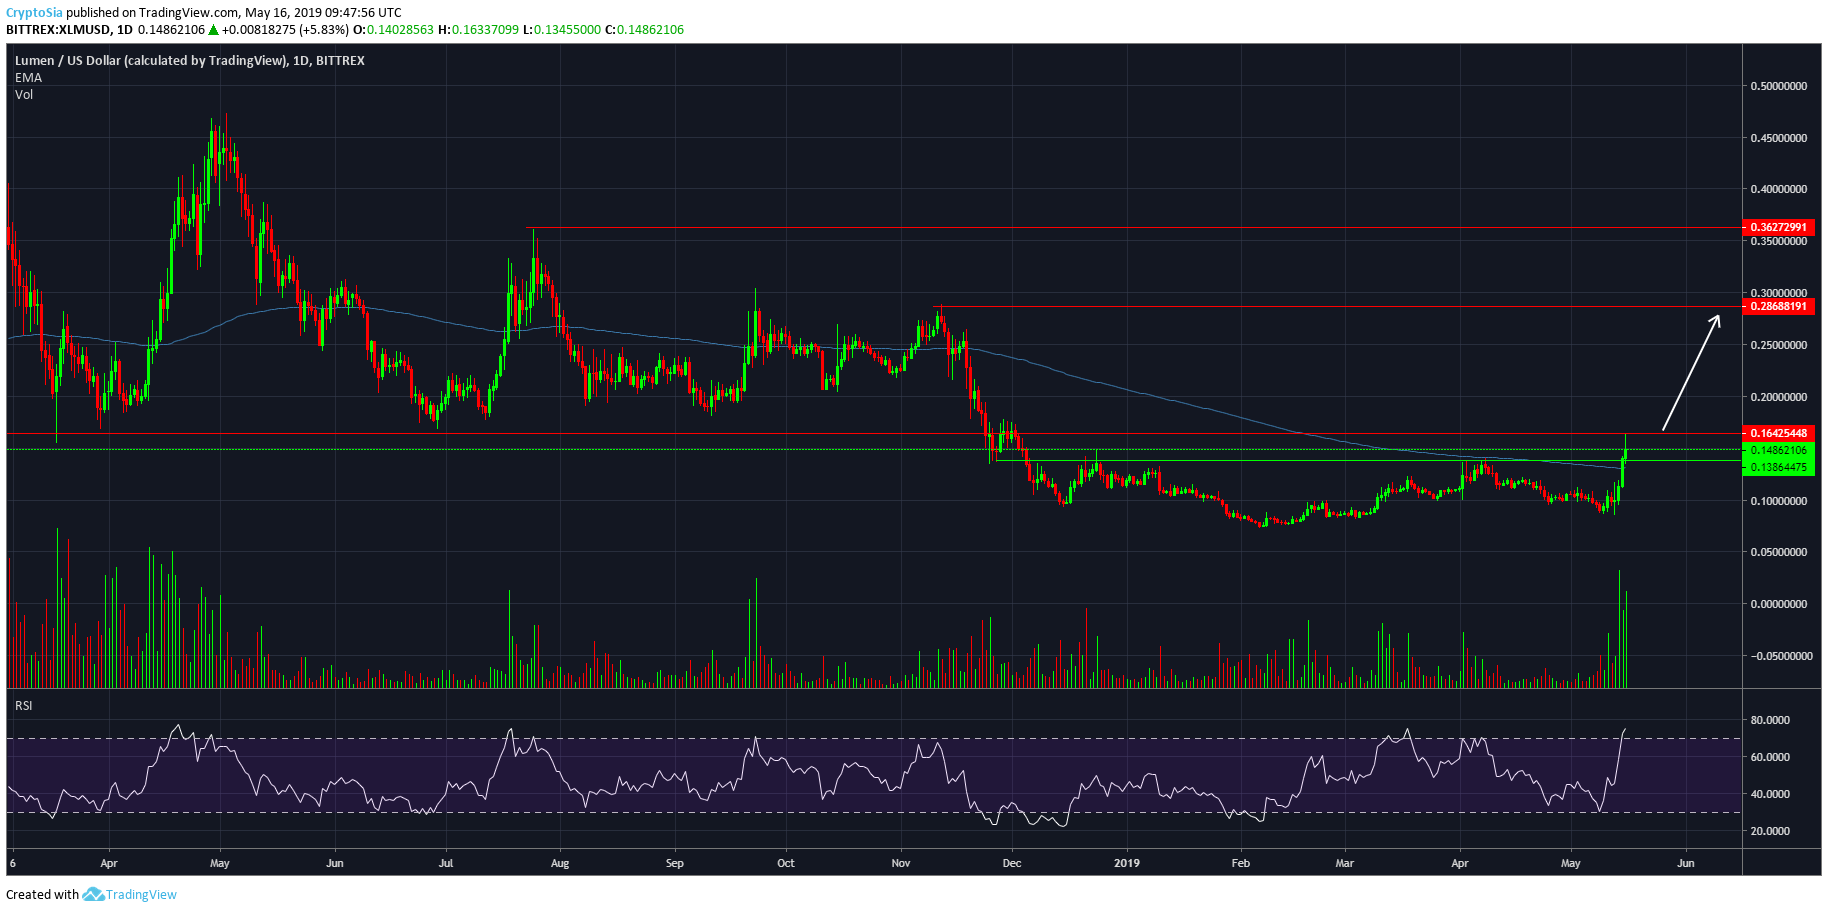
XLM/USD chart provided by Tradingview
If we pull up the Fib extension tool, on the hourly and measure the first impulse wave from it swing high to swing low, we can see that all major resistance lines from the first initial wave on the smaller time frames has been hit. Therefore we should be looking for a support level to where XLM will retrace to after this heavy increase.
$0.136 first support
Our support line from the higher time frames seems to agree with the smaller time frame since our $0.136 support target is lining up almost perfectly with the 2.61 Fib line, providing confluence in the analysis. For now XLM seems to have found its local resistance and is making its way towards our support of $0.136. Below that we have strong support at $0.116 in case we get a bigger retracement than expected.
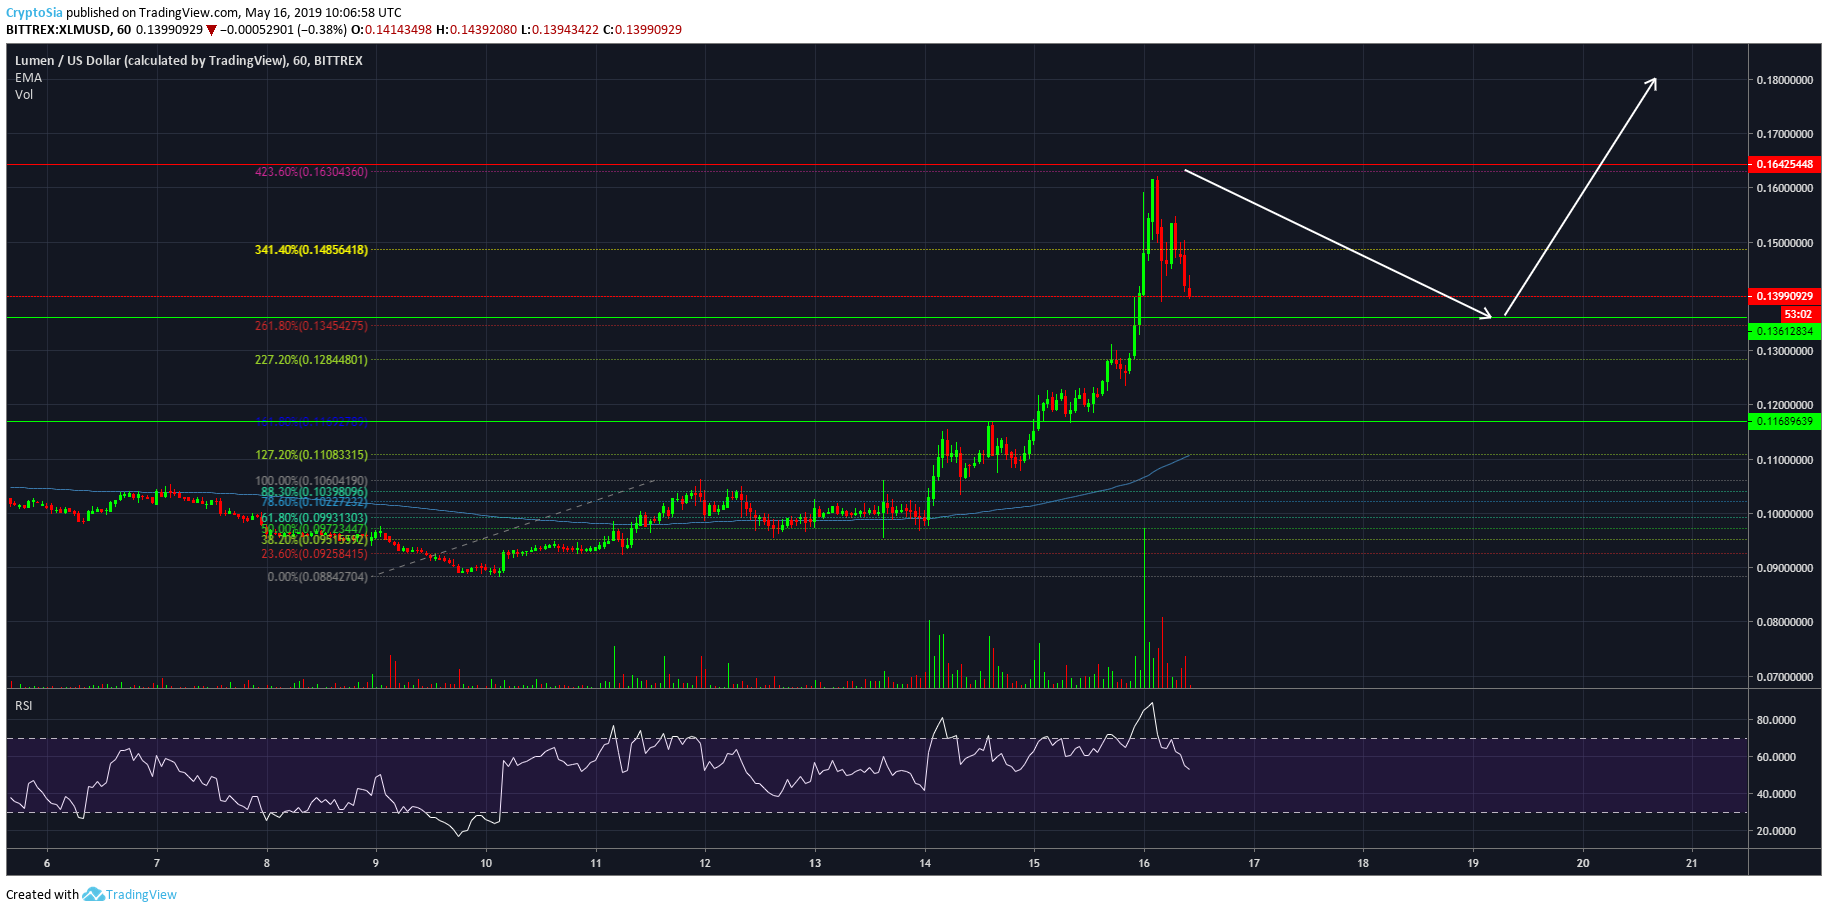
XLM/USD chart provided by Tradingview
XLM is looking very good after it cleared the 2019 resistance, but the heavy increase this past requires a small retracement before we can continue up. Will $0.136 prove support during this bull market, or is a deeper retrace to $0.116 possible? Let us know what you think in the comments below!
Disclaimer: Keep in mind this not investment or trading advice, just the opinion of our analysts. As always, do your own research, make your own decisions.