The latest on-chain data in the Bitcoin and cryptocurrency market continues to generate important signals about investor behavior and market structure. While the Bitcoin price is trading at $78,026, liquidation data in derivative markets and on-chain indicators present a noteworthy picture.
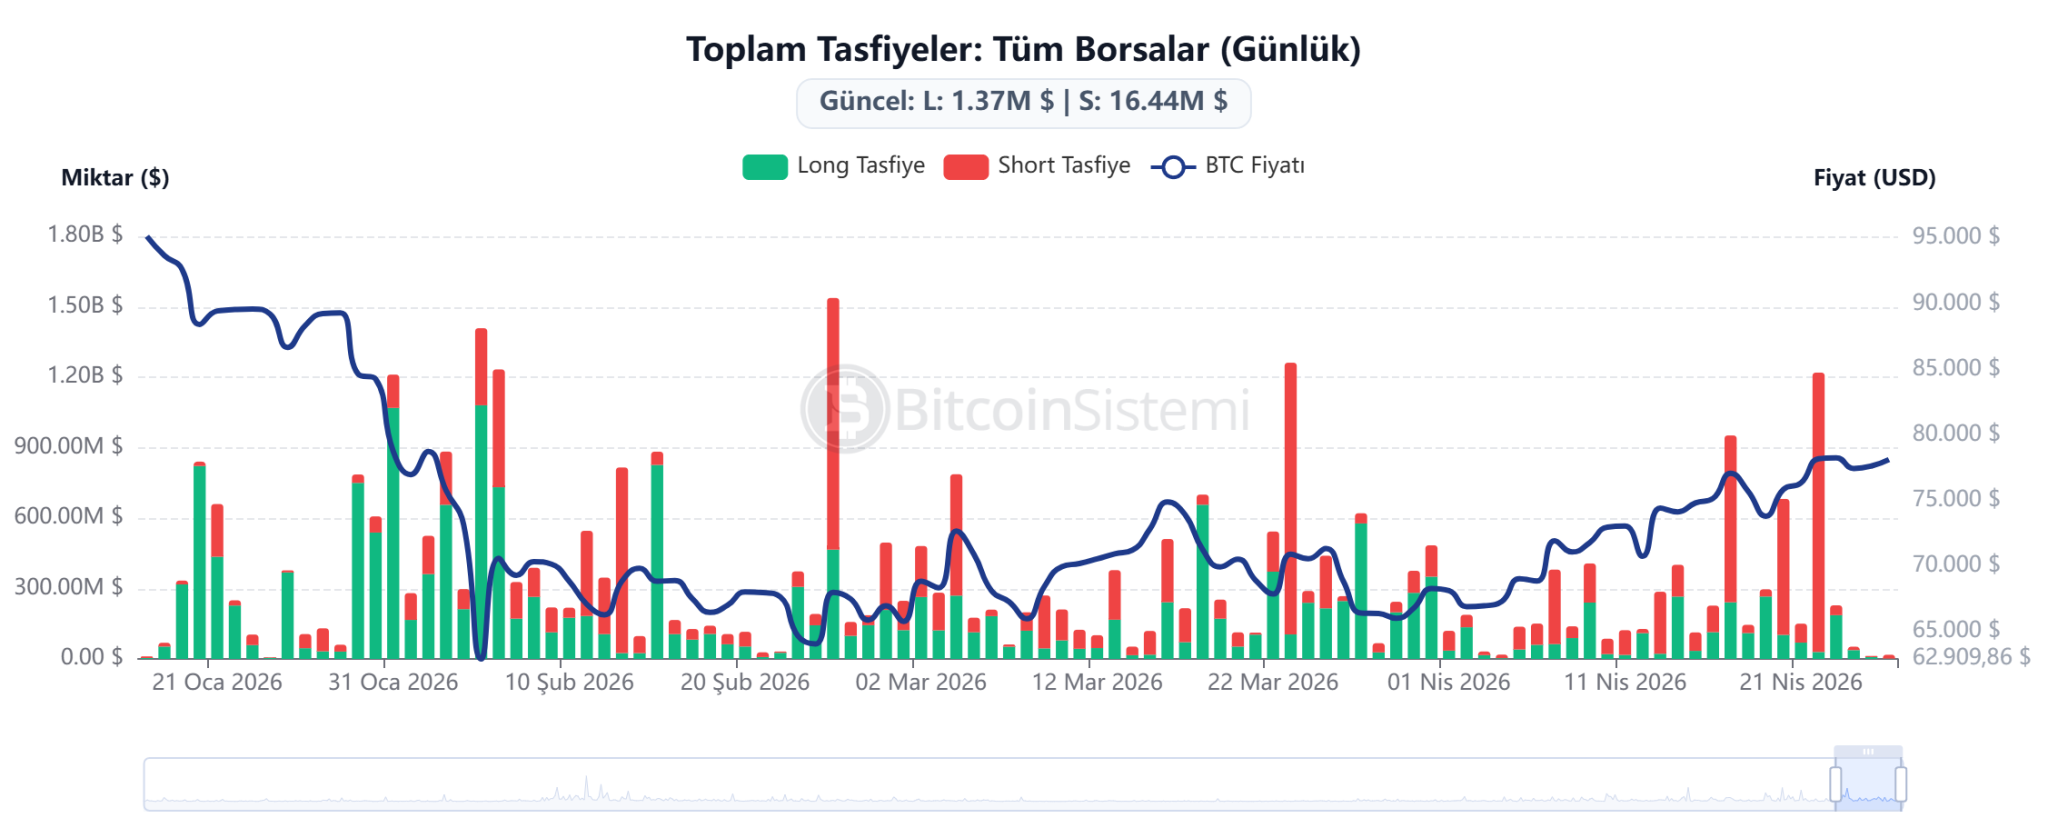
Looking at the liquidation data for the last 24 hours, a total of $26.06 million worth of positions were liquidated. Of these liquidations, $18.53 million consisted of short positions, while long positions remained at $7.53 million. Thus, the fact that 71.1% of the liquidations came from short positions indicates that upward movements in the market are putting pressure on short positions and that a “short squeeze” effect is coming into play.
The Fear and Greed Index, which measures market sentiment, remains in the “fear” zone. Although the index value has risen to 33, it indicates a limited recovery compared to yesterday’s level of 31 and last week’s level of 27. The current level, which was 13 last month in the “extreme fear” zone, suggests a cautious improvement in investor psychology, but still reveals a distance from strong optimism.
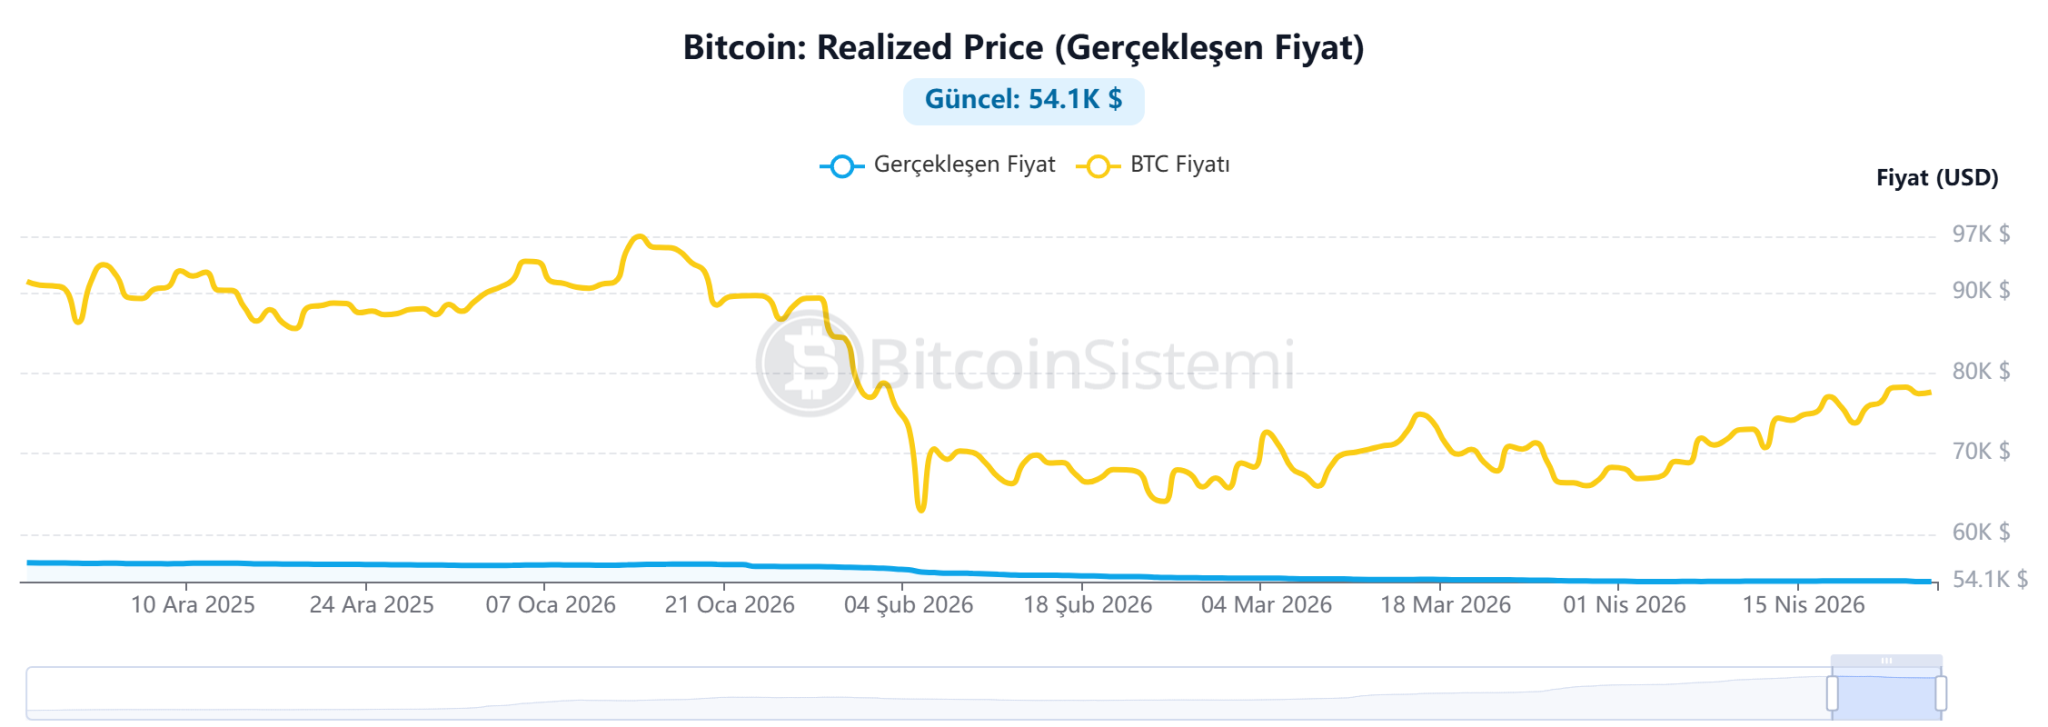
One of the most critical indicators on the on-chain side, the realized price, is currently at $54,100. The fact that Bitcoin’s current price is well above this level suggests that the market is generally profitable and that this area could act as strong support for long-term investors.
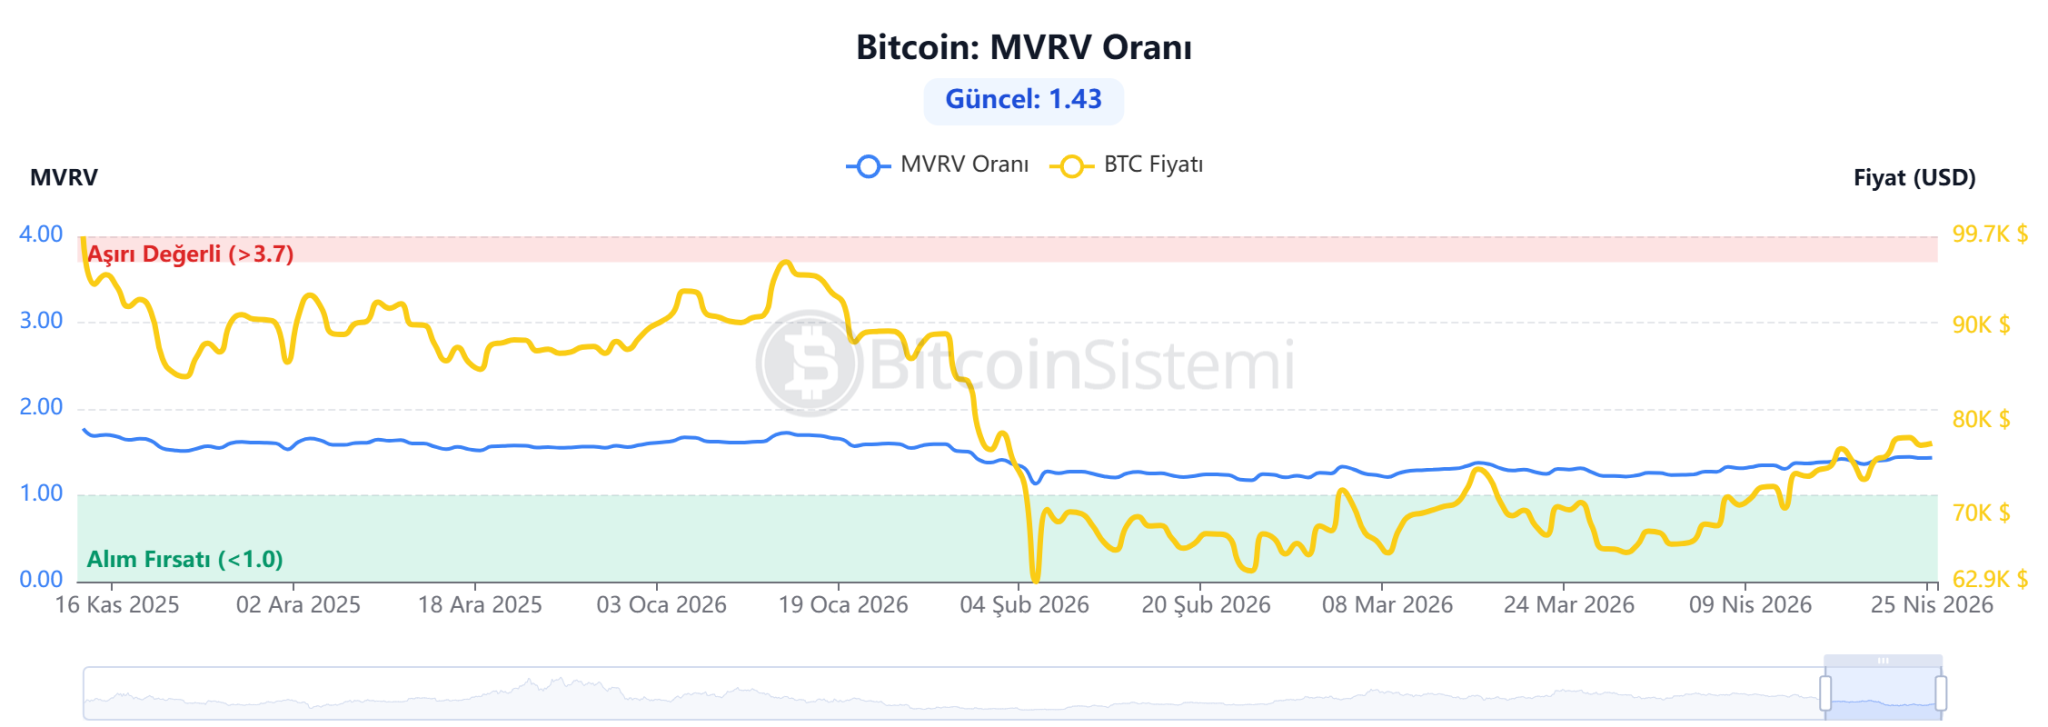
Another important metric, the MVRV ratio, is measured at 1.43. This value indicates that the market has not yet entered the overvalued zone, but it is also moving away from its lows. Analysts note that periods when the MVRV is between 1 and 2 generally correspond to “equilibrium” and gradual upward phases. This suggests that Bitcoin is currently neither in a bubble nor in a bottom zone, but rather progressing through a medium-term growth phase.
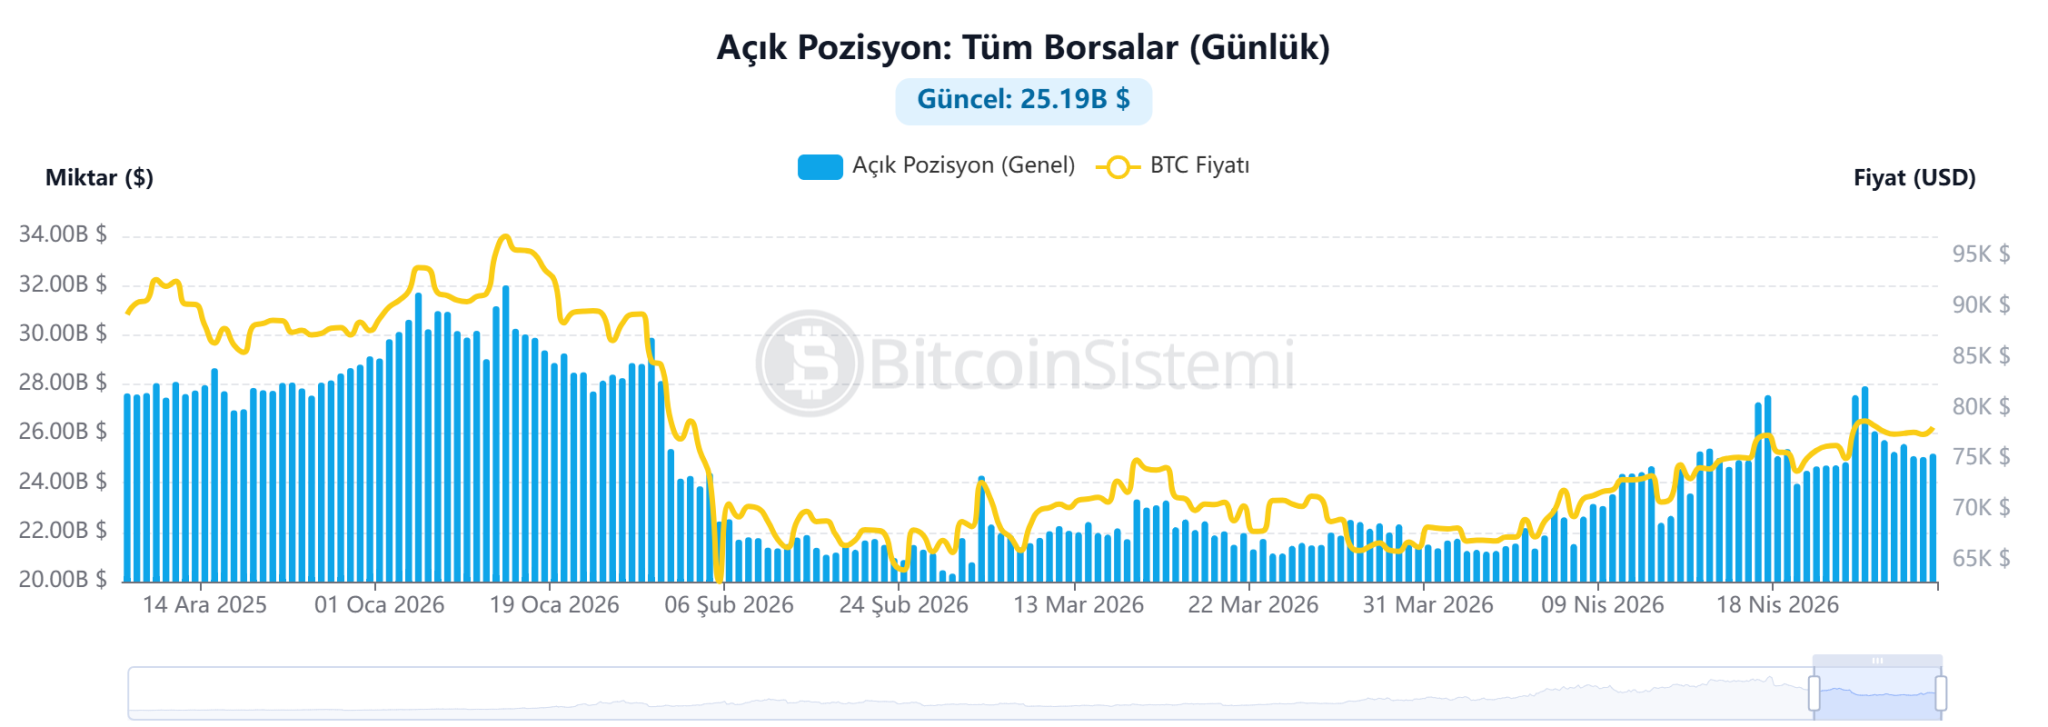
The open interest data, which indicates the size of the derivatives markets, stands at $25.19 billion. This high open interest level suggests significant leveraged trading in the market and high potential volatility. According to experts, these levels point to a “fragile” market structure where large liquidation waves could occur during sudden price movements.
*This is not investment advice.