Teucrium Brings Leveraged $BNB Exposure to Traditional Markets
The XBNB fund gives investors a way to gain leveraged $BNB exposure through a traditional brokerage account, including retirement accounts where available, without directly holding the token. The product uses futures or swap-based derivatives and rebalances every day to maintain its 2x target. If $BNB futures rise 1% in a session, the ETF aims to rise 2%. If futures fall 1%, the product is structured to lose 2%.
That daily reset feature is a core part of how leveraged ETFs work. It also means returns can drift from the underlying asset when volatility remains high over several sessions. For that reason, the structure is generally viewed as a short-term trading vehicle rather than a long-term investment tool. The reported expense ratio is around 1.89%, which is higher than standard equity ETFs and closer to other specialized leveraged crypto products.
As of today, no U.S. spot $BNB ETF has been approved yet. Several spot filings remain under review, including proposals linked to VanEck and Grayscale. Until then, XBNB becomes the first U.S.-traded ETF directly tied to $BNB market performance, even though it relies on derivatives rather than spot token holdings.
$BNB Price Structure Holds Key Support Near $600
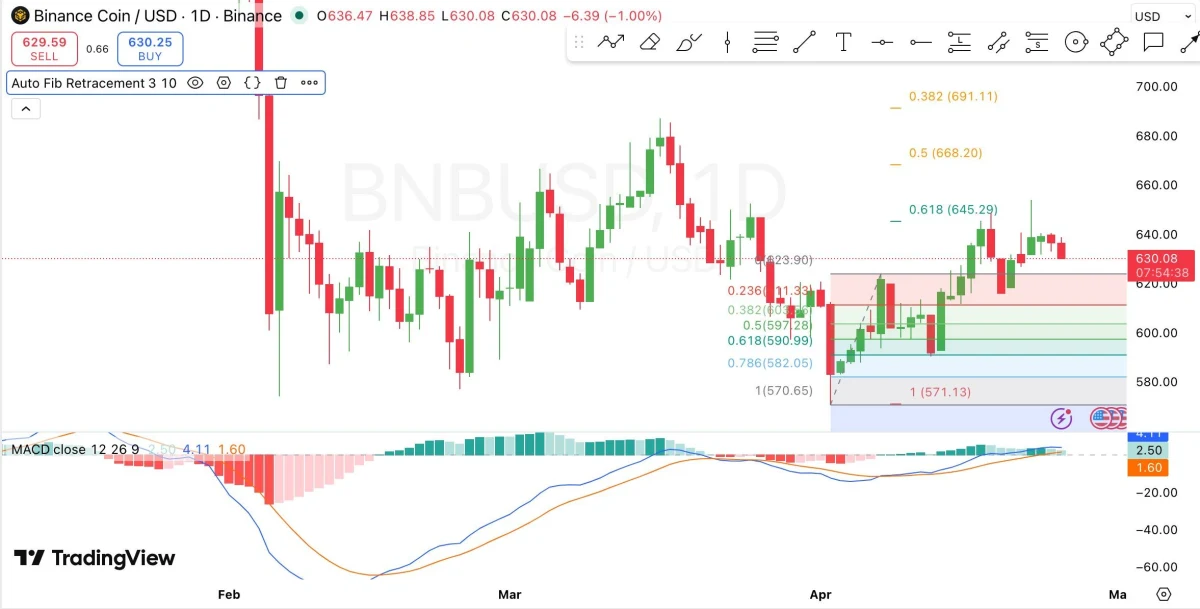
$BNB’s chart structure remains range-bound. The token recovered from the $570 to $580 demand zone and has since formed a pattern of higher lows, which points to underlying buyer support. Even so, the recent move into the $645 to $650 area faced rejection, showing that sellers are still active around that upper band.
The current range sits between about $600 and $645. Immediate support is being tested around the $603 area, while the $597 region acts as an important mid-range pivot. As long as $BNB holds above the broader $600 to $605 zone, the market structure remains neutral to slightly bullish. A break below that band would place more attention on the $582 level and then the earlier demand zone near $570.
Source: TradingView
According to the MACD reading, bullish strength is fading, with the histogram flattening and the signal lines close to a bearish crossover. That setup supports the view that $BNB is consolidating rather than breaking into a stronger trend at this stage. Consequently, the near-term $BNB price prediction now rests on whether buyers can push through the resistance ceiling near $645 to $650.
A clean close above that area would open room for $BNB price toward about $668 and then possibly the $690 region, based on the Fibonacci levels referenced in the chart analysis. Such a move would confirm that the recovery from the lower support zone is still active. If $BNB loses the $600 support area instead, traders are likely to look for another move toward $580 to $570.

 coinpaper.com