Bitcoin ($BTC) is now seeing "tepid" demand just three months after hitting its latest all-time high, according to on-chain analytics firm Glassnode.
In a tweet on Feb. 18, researchers flagged a sea change in Bitcoin on-chain activity compared to just three months ago.
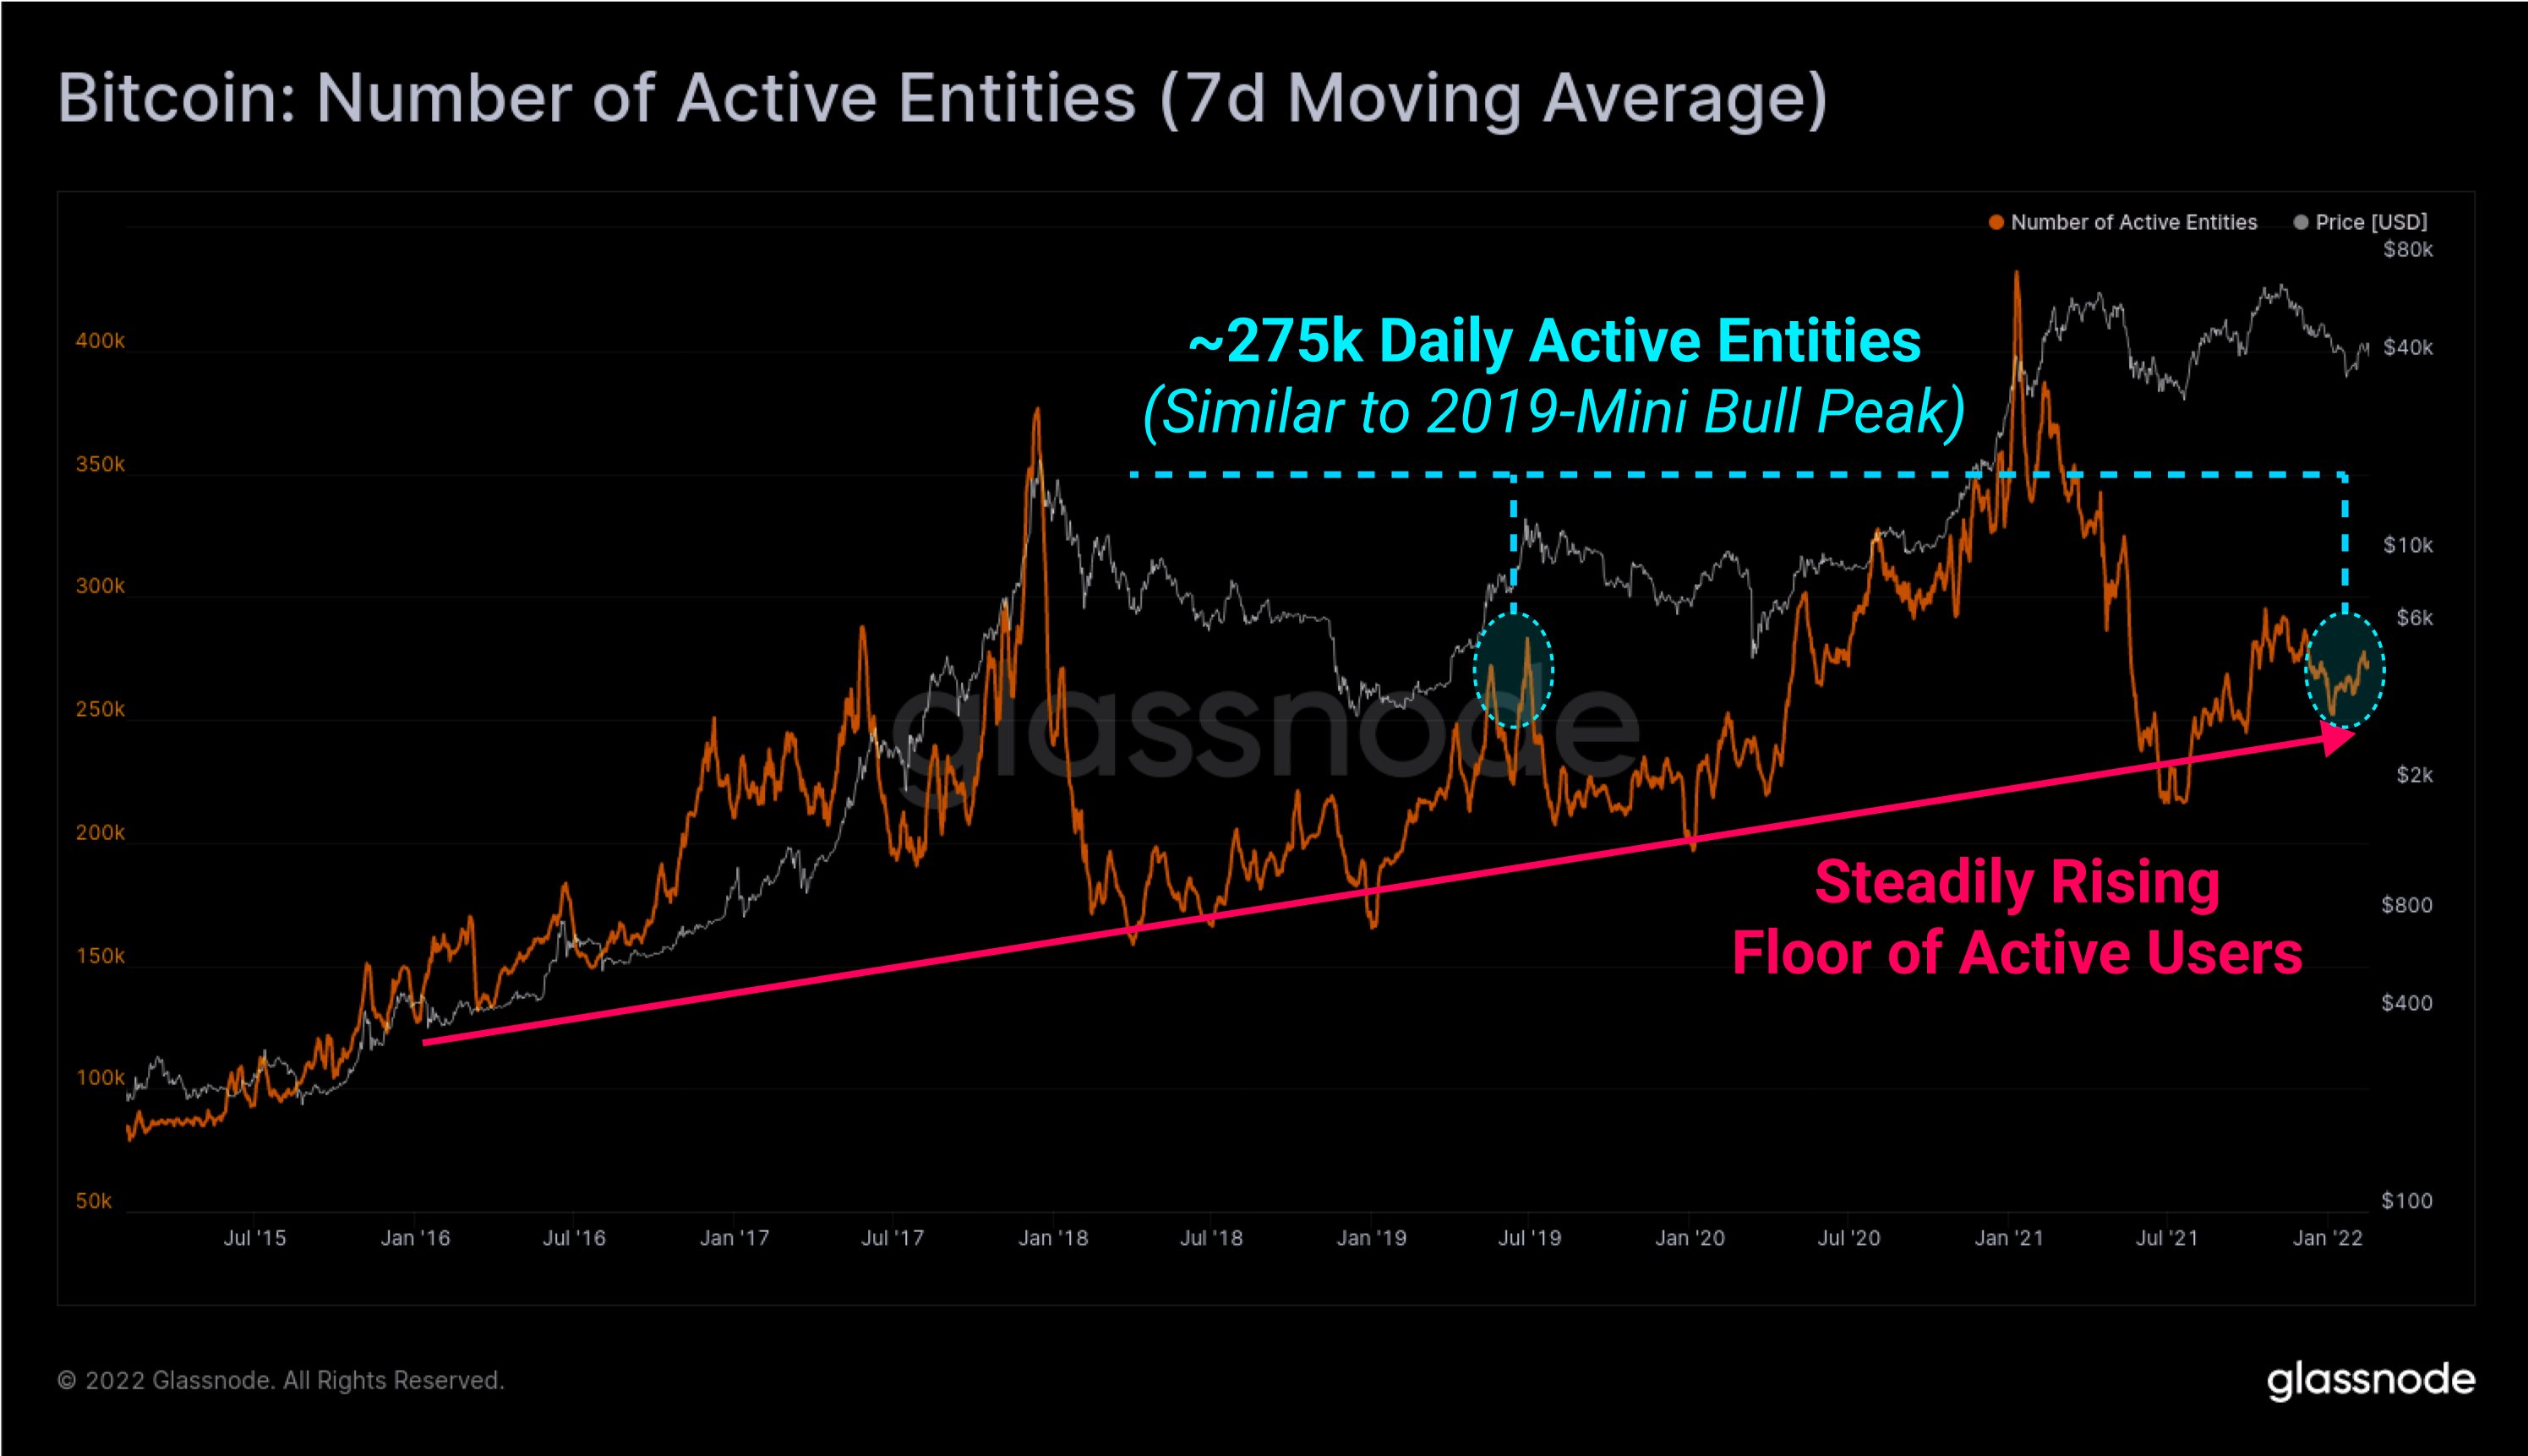
Bitcoin active entities echo 2019 "mini bull peak"
Bitcoin's descent from $69,000 to $33,000 has been accompanied by a widely-publicized crash in interest from mainstream consumers.
Now, the latest data shows that for existing on-chain entities — holders of one or more wallets — the same true.
Each day, the Bitcoin network sees around 275,000 active entities transacting, compared to over 400,000 in November 2021.
That reduction means that daily active entities are now at the same levels as in mid-2019 and even well below the peak of the last halving cycle in December 2017.
"This level of activity is far below bull market highs, indicative of tepid demand from new users," Glassnode commented.
Researchers added that regardless of the cycle phase, the trend is for entity numbers to grow, which they put down to Bitcoin's network effect playing out as forecast.
While the activity dip is considerable for such a short space of time, as Cointelegraph reported, wallet numbers are going up only, and those containing 0.01 $BTC (around $400) or more now number almost 10 million.
Discussing the Glassnode data, popular Twitter account TXMC argued that even if the entities involved were or are not human, there is still a reason for them to send $BTC over the network, thus validating the entity numbers at a given point.
"This level of activity is far below bull market highs, indicative of tepid demand from new users," it argued.
"Up and to the right"
In the latest edition of its "Uncharted" newsletter, meanwhile, Glassnode likewise confirmed that on-chain demand is in a trend of "up and to the right."
Related: Bitcoin inactive supply nears record as over 60% of $BTC stays unspent for at least 1 year
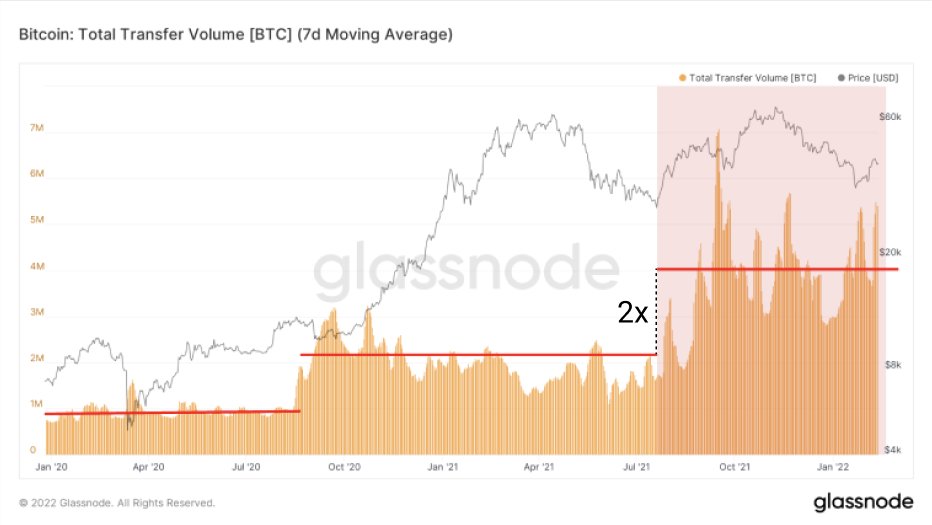
Daily transfer volume surged in the middle of last year, and the weekly moving average is now twice that of October 2020 before $BTC/USD broke out of its three-year range.
Since January 2021, long-term hodlers — wallets with funds unmoved in at least 155 days — have added 3 million $BTC to their balances in another sign of long-term conviction.
"Institutions in the market are a sign of greater adoption," Glassnode co-founders Yann Allemann and Jan Happel added in Twitter comments last week.