- Bitcoin price prediction expects a rise in price.
- Strongest support currently lies at $57,489.
- Strongest resistance currently lies at $59,869.
Bitcoin price prediction analysis reveals that the king of cryptocurrency is ready to hike the price after completing the second reverse head and shoulder pattern in the past five days. The first reverse head and shoulder pattern was completed on the 19th of November 2021, and the price went as high as $58,337. The second reverse head and shoulder pattern was completed on the 20th of November 2021, but the reminiscence extends well into the 21st of November price movement. In this chart, we will have a thorough insight into the current market trend, which will help us analyze and predict the future BTC/USD prices.
BTC/USD 4-hour Price Chart: Market is losing volatility
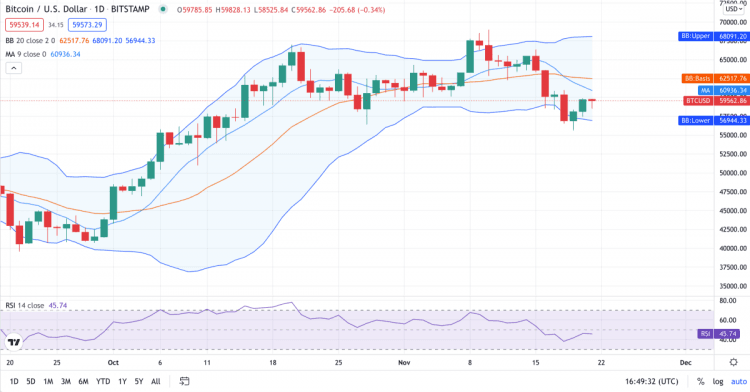
Bitcoin price prediction is that the Bollinger’s band shows that the volatility has decreased in the past few days with the king of cryptocurrency reigning supreme in the cryptocurrency industry. The lower limit of the Bollinger’s band resting at $56,104 being the support and the upper limit at $60,319 being the resistance. The BTC/USD price crosses over the moving average curve, which shows a positive incline in the chart indicating a bullish movement. The chart shows the Relative Strength Index (RSI) at 52 meaning that it is neither overbought nor undervalued, it indicates no signal. Hence, cryptocurrency royalty has yet again proven to be unbeatable in the market. The decreasing volatility indicates that the market price of the assets is less prone to change or spread, which means that the price will remain somewhat unvarying.
Bitcoin price analysis: Conclusion
The conclusion of the Bitcoin price prediction is that we have observed the current behaviour of the reigning king of cryptocurrency is following a rather bullish trend, with tiring away at the $70,000 mark. The chart analysis shows that with the steady bullish momentum, it is predicted that the king will soon enter the $70,000 mark range, but if the current support fluctuates, we may see a decline in the prices as far as $60,000. We have observed that the current stable resistance lies between $60,000 to $68,000. This means that the bulls are coming in very strong and they are controlling the market, the bears need to step up their game if they hope to bring a decline in the price of the assets and capture the market.