Shiba Inu price analysis — Analyzing if SHIB buyers can defend $0.00000426
ambcrypto.com
9 m
Like much of the cryptocurrency market, Shiba Inu, $SHIB, has been facing selling pressure lately, with the token down 1.76% to $0.00000439 over the past 24 hours. The same was the case with Bitcoin, with the total crypto market capitalization down by 1.98%.
The wider market’s sell-off is a cumulative reaction to a multitude of factors that have unfolded worldwide over the past week, primarily caused by political uncertainty post-U.S. midterms, Fed rate hike fears, and geopolitical tensions. Additionally, as $SHIB is a high-beta memecoin, it has followed in the footsteps of Bitcoin’s decline. Subdued ecosystem activity has offered little support so far.
Nevertheless, buyers could be attempting to defend the $0.00000426-support level.
Know when your coins move
Alerts, real-time prices, and market news — all in one app
Point your phone camera to install
4.8 based on 40K reviews in the App Store and Google Play
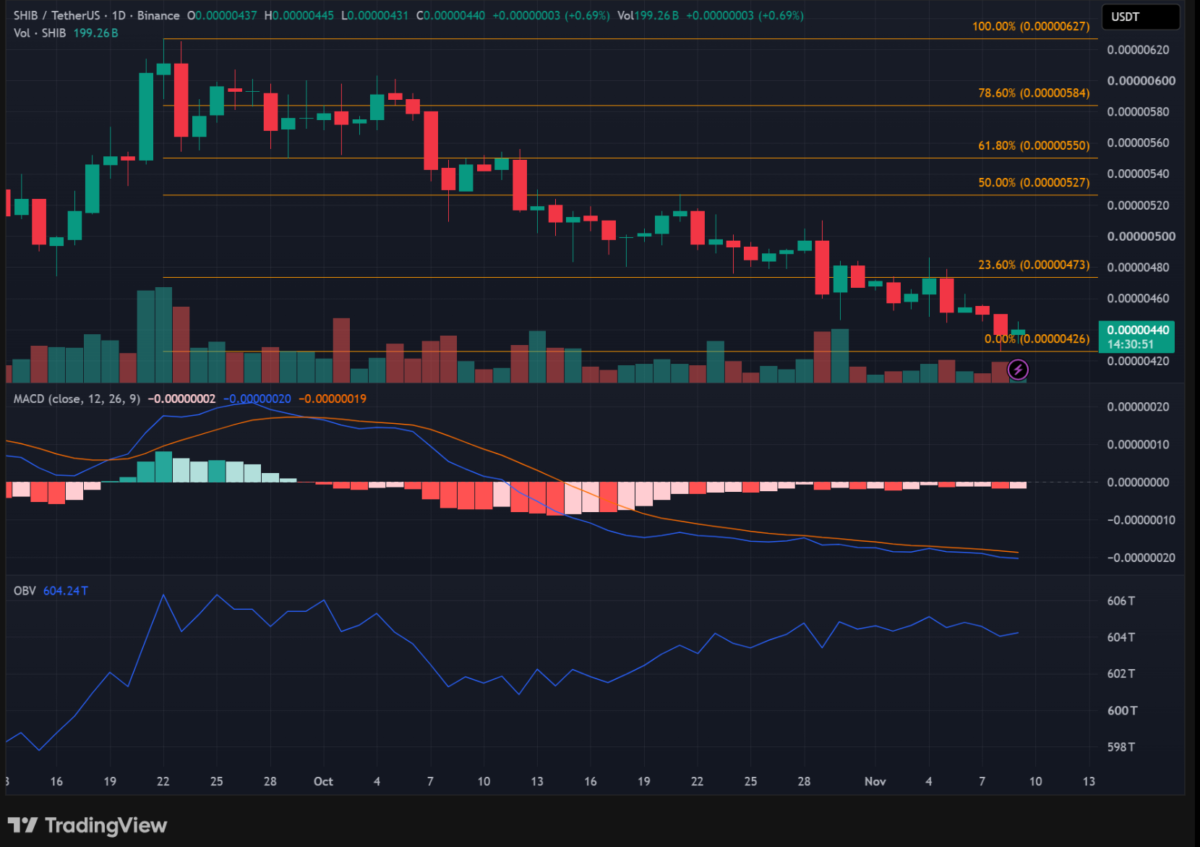
$SHIB’s daily structure remains bearish
Source: $SHIB/$USDT, TradingView
$SHIB’s daily chart showcased its bearish trend. However, early signs of a recovery seemed to be forming too. At the time of writing, the altcoin was trading at $0.00000440, within the lower end of the 0%–23.6% Fibonacci retracement zone. Despite sustained selling pressure, buyers have been attempting to defend the $0.00000426 support level.
Momentum indicators suggested that bearish pressure, while in place, had started to ease too. The MACD was still below both its Signal and Zero lines, pointing to a bearish trend. However, the narrowing gap between the two lines suggested that the selling momentum could be losing strength.
Additionally, the recent uptick in OBV indicated that buying interest had started to grow again, especially around these press time levels. However, this needs to be sustained and accompanied by stronger volume before a more convincing recovery can take shape.
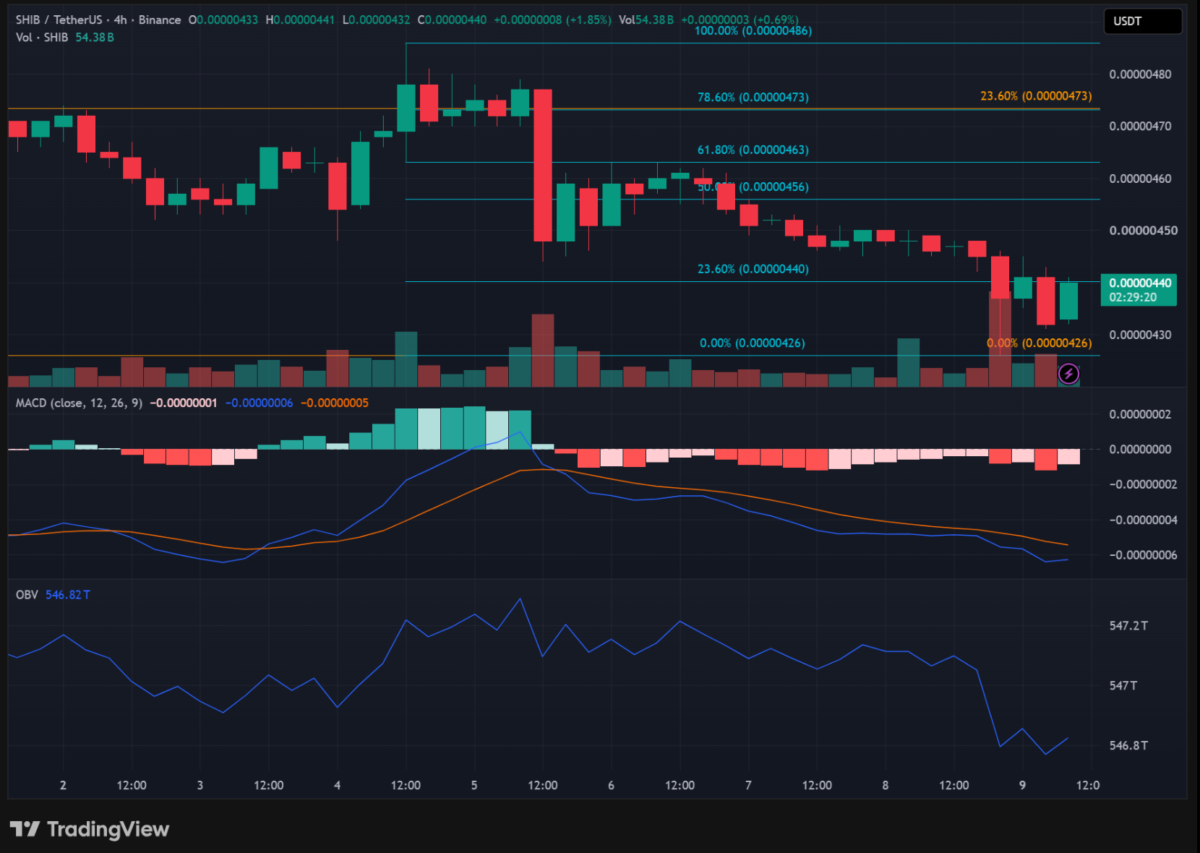
Can $SHIB reclaim the 23.6% Fibonacci level?
Source: $SHIB/$USDT, TradingView
The 4-hour chart lent further insight into the altcoin’s press time price action, with $SHIB attempting to break above the 23.6% Fibonacci retracement level. A successful move above this resistance would make a short-term recovery more likely. Especially as it suggested that buyers were becoming more willing to step in. However, the level still needs to be reclaimed for the sentiment to shift.
The MACD showed an early improvement, with its line turning upwards towards the Signal line, although both remained below zero. This suggested that despite selling pressure starting to decline, bearish momentum would still be dominant.
Furthermore, the OBV also ticked higher on the charts, hinting at a fresh wave of buying activity.
Together, these signals suggested that buyers have been making an attempt to build momentum. However, recovery will remain tentative without stronger volume and a sustained move above resistance.
Final Summary
$SHIB’s daily structure has been bearish despite early signs of buying interest.
A sustained H4 recovery above $0.00000440 could strengthens the bullish case.

 ambcrypto.com