
 en.cryptonomist.ch
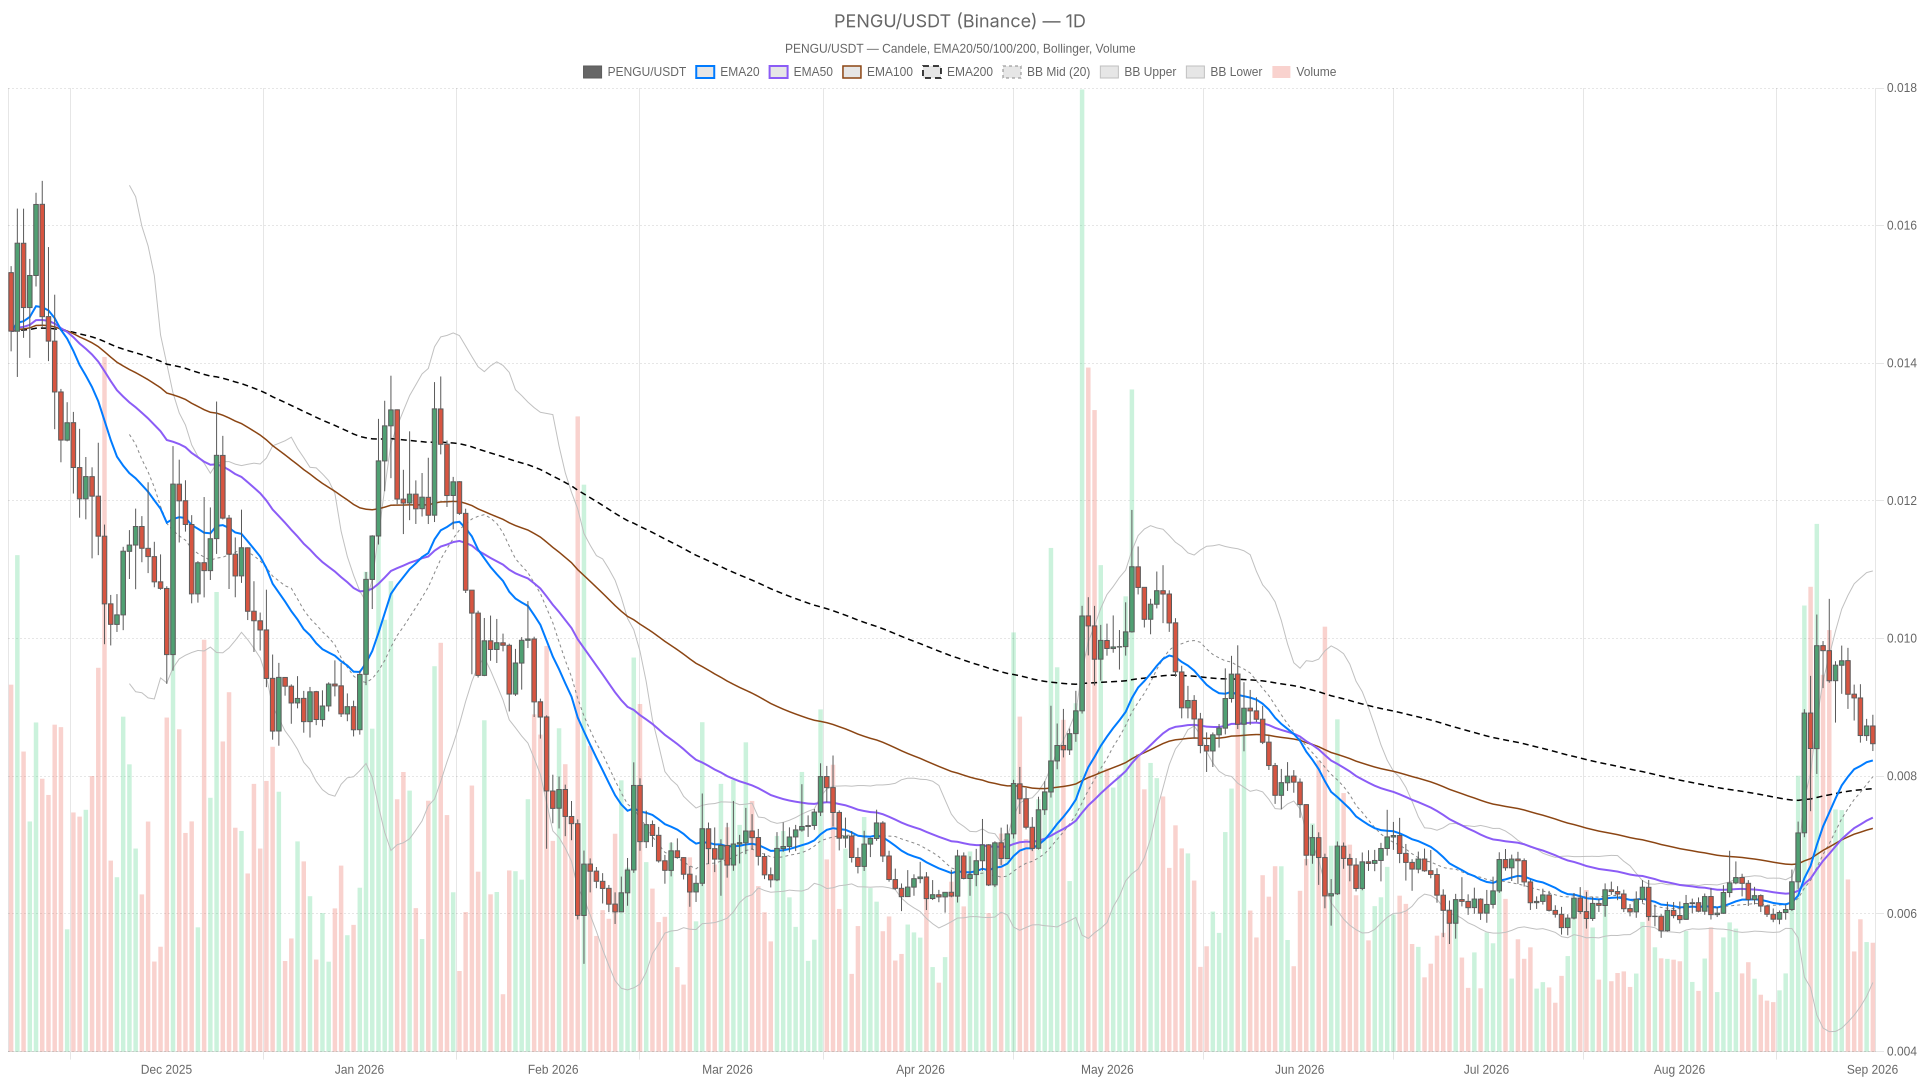
As of September 1, 2026, the market finds Pudgy Penguins crypto in a tense in-between phase where the daily chart refuses to commit and the hourly chart already leans bearish. Trading tightly near $0.01 with moving averages compressed, the setup signals a looming decision point rather than a trending market.
Key takeaways
- Daily RSI14 sits at 56.34, neutral with a mild constructive lean above the 50 midline.
- Hourly RSI14 has dropped to 38.62, confirming short-term bearish pressure.
- The broader crypto market cap fell 3.82% as Bitcoin dominance climbed to 59.12%.
- Bollinger Bands and ATR show extreme compression, signaling an outsized move could follow once the range breaks.
- The Fear & Greed Index reads 69 (Greed), creating a mismatch with the ongoing market pullback.
Meanwhile, the broader backdrop is not exactly calm. The total crypto market cap slipped 3.82% over 24 hours to roughly $2.63 trillion, according to CoinGecko, while Bitcoin dominance climbed to 59.12%. That combination is a classic risk-off signal for altcoins like $PENGU: when capital concentrates into $BTC during a drawdown, smaller-cap tokens tend to stall or bleed harder.
However, the Fear & Greed Index reads 69, still in Greed territory, which creates a mismatch worth flagging. Sentiment has not yet caught up to the pullback, and that gap often resolves through either a sharp reversal or a delayed capitulation. Meanwhile, on-chain DEX activity tells a different story: DefiLlama figures show Fluid DEX fees jumping 300.97% in a single day and Uniswap V4 fees rising 131.7%.
Daily Chart: Neutral Regime, But RSI Leans Constructive
The daily timeframe remains officially neutral, with RSI14 at 56.34 signaling mild buying interest rather than aggressive demand. The EMA20, EMA50, and EMA200 are all stacked essentially on top of each other, meaning no meaningful trend structure exists yet. MACD is flat across the line, signal, and histogram: no bullish or bearish cross, just equilibrium.
Moreover, Bollinger Bands are pinched with the mid, upper, and lower bands converging, while ATR14 sits near zero, confirming realized volatility has dried up. Pivot support and resistance levels are also clustered together, offering little room to define a tradable range on this timeframe alone. Put simply: the daily chart is coiled, not trending.
1H Chart: Where the Tension Between Timeframes Shows Up
The 1H regime flips to bearish, with RSI14 at 38.62 confirming sellers have had the upper hand in the shorter window, even while the daily leans neutral-to-mild-bullish. That is a real disagreement between timeframes, not a footnote. When the higher timeframe is indecisive and the lower timeframe already shows weakness, the market is testing whether dip demand actually exists before committing to the next move.
Furthermore, the 1H MACD is also flat, so this is not a momentum breakdown but rather a grind lower without acceleration. That profile carries a very different risk than a sharp selloff. Traders should treat the hourly bearish tag as a warning sign about near-term chop rather than proof of a broader trend reversal.
15m Chart: Execution Context
Meanwhile, the 15-minute regime returns to neutral, with RSI14 at 48.17 sitting almost exactly at the midpoint and offering no clear directional bias either way. This timeframe does not tell a directional story; it simply confirms that intraday price action is balanced and best used for timing entries or exits around whatever the higher timeframes eventually decide.
Bullish Scenario
If $PENGU holds above its current EMA cluster and the daily RSI continues drifting higher above 56, that would signal buyers are absorbing the hourly weakness rather than getting overrun by it. A recovery in the 1H RSI back above 50, paired with the daily regime shifting from neutral toward a more clearly bullish tag, would provide the confirmation bulls need. This scenario gets invalidated if the 1H bearish pressure drags the daily RSI back toward the 50 line.
Bearish Scenario
Conversely, if the 1H bearish regime persists and starts pulling the 15m RSI decisively below 48 alongside it, sellers gain real control and the daily neutral bias begins to erode. Given how compressed ATR and Bollinger Bands currently are, any breakdown from this squeeze could move faster than recent price action suggests, precisely because volatility has been so suppressed. The bearish case is invalidated if daily RSI holds above 50 and the 1H regime flips back to neutral or bullish.
Positioning and Risk
Right now, Pudgy Penguins crypto is caught between a daily chart that is not picking a side and an hourly chart that is already leaning bearish. That tension is the whole story, and it has not resolved yet. The extreme compression across ATR and Bollinger Bands means whichever direction wins this tug-of-war could see an outsized move once it breaks.
Adding to the pressure, a broader market down nearly 4% in a day with dominance rotating toward Bitcoin builds the case for caution on its own. None of this is a signal to act blindly in either direction. It is a reminder that volatility is coiled, sentiment and price are currently disagreeing, and the next confirmed move on the daily timeframe will matter far more than anything on the 15-minute chart today.
FAQ
What is the current bias for $PENGU?
The daily chart shows a neutral bias with RSI14 at 56.34, reflecting mild buying interest without conviction. The 1H chart, however, is bearish with RSI14 at 38.62, indicating sellers have dominated the shorter timeframe. This disagreement between timeframes is the defining feature of the current setup.
Why does the volatility compression matter right now?
Bollinger Bands and ATR are extremely compressed, which means realized volatility has nearly dried up. When price eventually breaks out of such a squeeze, the move tends to be outsized relative to the preceding range. This makes the current calm potentially misleading as a predictor of near-term conditions.
What would confirm a bullish reversal for $PENGU?
A bullish confirmation would require two things: the daily RSI continuing to drift above 56, and the 1H RSI recovering back above 50. Together, these would signal that buyers are absorbing the hourly weakness and that the daily neutral bias is tilting constructive. Without the 1H recovery, the bullish case remains unconfirmed.
How is the broader crypto market affecting $PENGU?
The total crypto market cap dropped 3.82% in 24 hours while Bitcoin dominance rose to 59.12%. This risk-off rotation concentrates capital in $BTC and tends to pressure altcoins like $PENGU, which either stall or decline more sharply during such phases.
Disclaimer: This article is for informational purposes only and does not constitute financial advice, an investment recommendation, or a solicitation to buy or sell any financial instrument or cryptocurrency. The analysis provided is not indicative of future results. Investing in crypto assets and financial markets carries a high risk of capital loss. Always do your own research (DYOR) and consult a qualified financial advisor before making any decision.
Article produced with the assistance of artificial intelligence and reviewed by the editorial team.