TRON Price Prediction: Can $2.1T USDT Activity Lift TRX?
coinedition.com
12 August 2026 19:30, UTC
TRON is showing renewed strength as rising stablecoin activity and improving spot flows support its latest price move. $TRX trades near $0.3356 after gaining 1.19% over the past 24 hours. The token has also climbed 2.77% over the past week. Meanwhile, TRON continues to handle enormous $USDT transfer volumes across its network.
Stablecoin Activity Strengthens TRON’s Case
TRON processed approximately $2.1 trillion in $USDT transfers, highlighting its growing role in stablecoin settlement. Additionally, $USDT supply on the network reached roughly $87.9 billion.
That scale gives TRON a stronger fundamental narrative beyond speculative DeFi activity. Stablecoins continue driving significant blockchain demand, particularly for payments and cross-border value transfers.
Know when your coins move
Alerts, real-time prices, and market news — all in one app
Point your phone camera to install
4.8 based on 40K reviews in the App Store and Google Play
TRON also recorded around 11.8 million daily transactions and approximately 3.6 million active addresses. Network fees recovered 15.9% to nearly $700 million.
$TRX keeps looking more like a payments network than a DeFi chain.
$USDT supply on Tron reached $87.9B in Q2, while transfers hit $2.1T.
Daily transactions climbed to 11.8M, active addresses to 3.6M, and fees rebounded 15.9% to nearly $700M.
What stands out to me is the split… pic.twitter.com/wlY5FfG5pg
— Senior 🛡🦇🔊 (@SeniorDeFi) August 11, 2026
Significantly, these figures suggest that users continue generating meaningful economic activity across the network. Besides, TRON’s growing settlement role could support demand for $TRX over time.
However, DeFi activity presents a mixed picture. Total value locked has declined toward $4.4 billion, while decentralized exchange volumes have weakened.
$TRX Technical Structure Turns Bullish
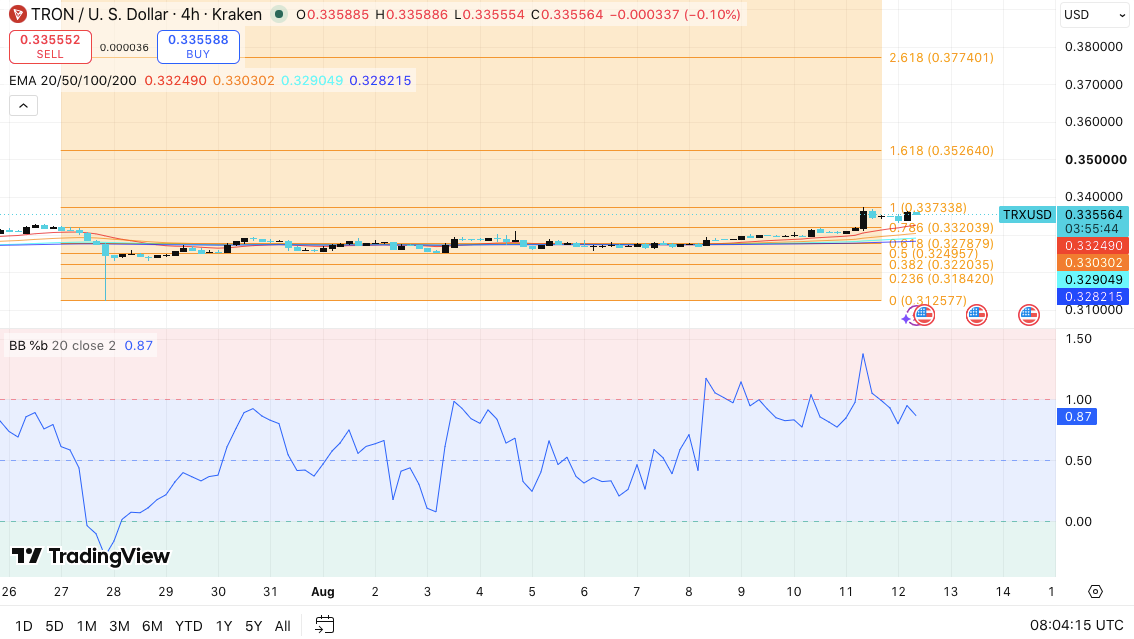
$TRX currently trades above its major four-hour exponential moving averages. That positioning supports the token’s short-term bullish structure.
Price also moved above the 0.786 Fibonacci level at $0.3320. Hence, buyers now control an important technical area.
The immediate resistance sits at $0.3373, which also represents the 1.0 Fibonacci level. A sustained four-hour close above that level could strengthen the breakout.
TRON Price Dynamics (Source: TradingView)
Consequently, bulls could target $0.3526, corresponding with the 1.618 Fibonacci extension. A stronger rally could then expose $0.3774 near the 2.618 extension.
However, momentum faces a potential near-term obstacle. The BB%B reading stands around 0.87, showing that $TRX trades close to the upper Bollinger Band.Therefore, traders could see short-term consolidation before another attempt higher.
Related: Ethereum Price Prediction: Is ETH’s Triangle Breakout to $2,150 Coming or Is the ETF Reversal a Warning Sign?
On the downside, $0.3320 to $0.3295 forms the first important support zone. A break below $0.3295 could shift attention toward $0.3260. Further weakness could expose $0.3202 and then $0.3139.
Open Interest Signals Cautious Positioning
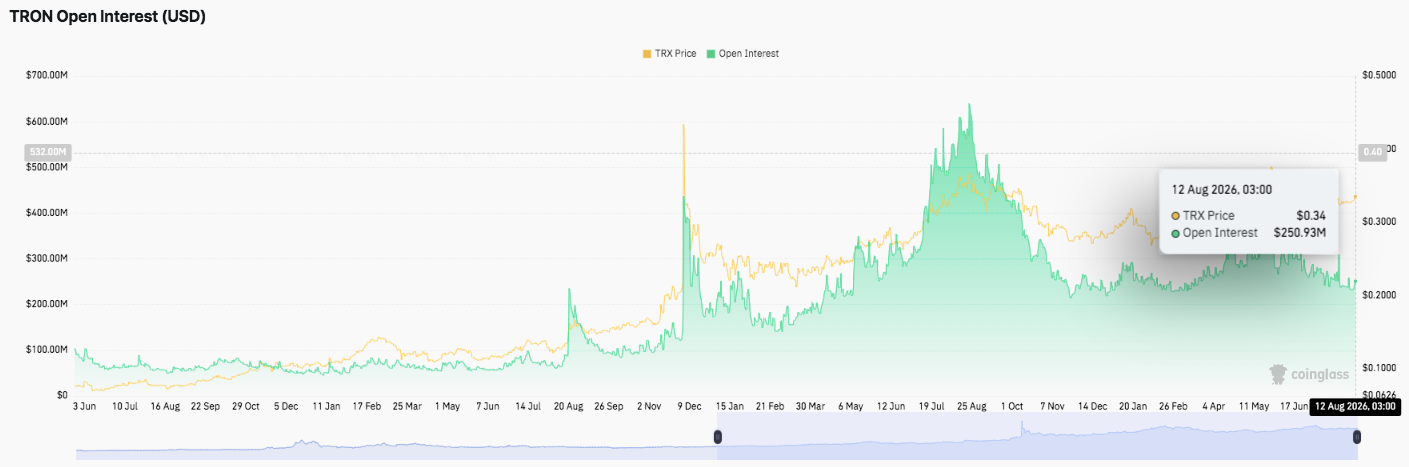
TRON’s derivatives market tells a more cautious story than its spot chart. Open interest reached approximately $640 million near the end of July.
Since then, OI has fallen steadily toward $250.93 million as of August 12. The decline suggests traders have reduced leveraged exposure during the recent consolidation.
Source: Coinglass
Additionally, OI remained between roughly $230 million and $280 million for much of the recent period. That range suggests derivatives participation remains active but considerably lower.
Related: Cardano Price Prediction: ADA Retreats From $0.20 as Analyst Warns of a Slide to $0.170
A recovery above $300 million could provide stronger confirmation for the next bullish move. Conversely, a drop below $230 million could signal renewed deleveraging. Hence, traders may need both price and derivatives participation to confirm a sustained breakout.
$TRX Flows Offer Another Bullish Signal
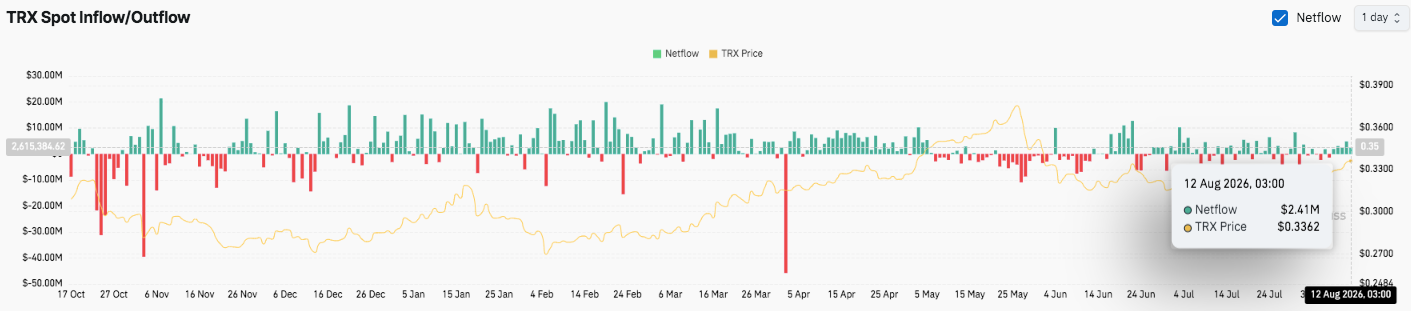
Spot market flows have gradually improved despite periods of heavy volatility. Earlier readings showed several sharp outflow spikes near $40 million and almost $50 million.
Those movements pointed to substantial selling pressure or exchange withdrawals during earlier phases. However, inflows have appeared more consistently since April.
Source: Coinglass
Recent positive readings generally ranged between $5 million and $20 million. The latest netflow reached approximately $2.41 million, indicating modest net buying pressure.
Moreover, the improving balance suggests selling intensity may have eased. That trend could complement $TRX’s technical recovery if inflows continue strengthening.
Technical Outlook for TRON Price
Key levels remain clearly defined for $TRX:
Upside levels: $0.3373 is the immediate hurdle, followed by $0.3526 and $0.3774. A decisive breakout above $0.3373 could strengthen bullish momentum and push $TRX toward the higher Fibonacci extensions.
Downside levels: $0.3320–$0.3295 forms the first support zone, followed by $0.3260, $0.3202, and $0.3139.
Resistance ceiling: $0.3373 remains the key level to flip for sustained bullish momentum. The technical structure favors buyers as $TRX trades above its major EMAs, although the elevated BB%B reading suggests possible short-term consolidation.
Will TRON Go Up?
$TRX’s near-term direction depends on whether buyers can defend $0.3295 and reclaim $0.3373 decisively. Stronger spot inflows and rising open interest could reinforce the bullish case.
Related: Velvet Price Prediction: VELVET Price Eyes $0.716 as Open Interest Falls From June Peak
A breakout could open the path toward $0.3526 and $0.3774, while losing $0.3295 could expose $0.3260 and lower. For now, $TRX remains at a critical technical juncture, with network activity providing an additional bullish catalyst.

 coinedition.com