Solana is pulling back into an area that now matters most for the short term trend. One chart shows price testing a micro support zone, while another keeps the bullish case alive as long as $SOL holds above the broader reversal area.
Solana Pullback Tests Key Micro Support Zone
More Crypto Online says Solana is moving toward a micro support zone while a broader wave two correction may still be in play. The chart shows $SOL trading near $83.53 after a pullback from the recent local high, with price now approaching the first key support area around $81.75 to $80.53.
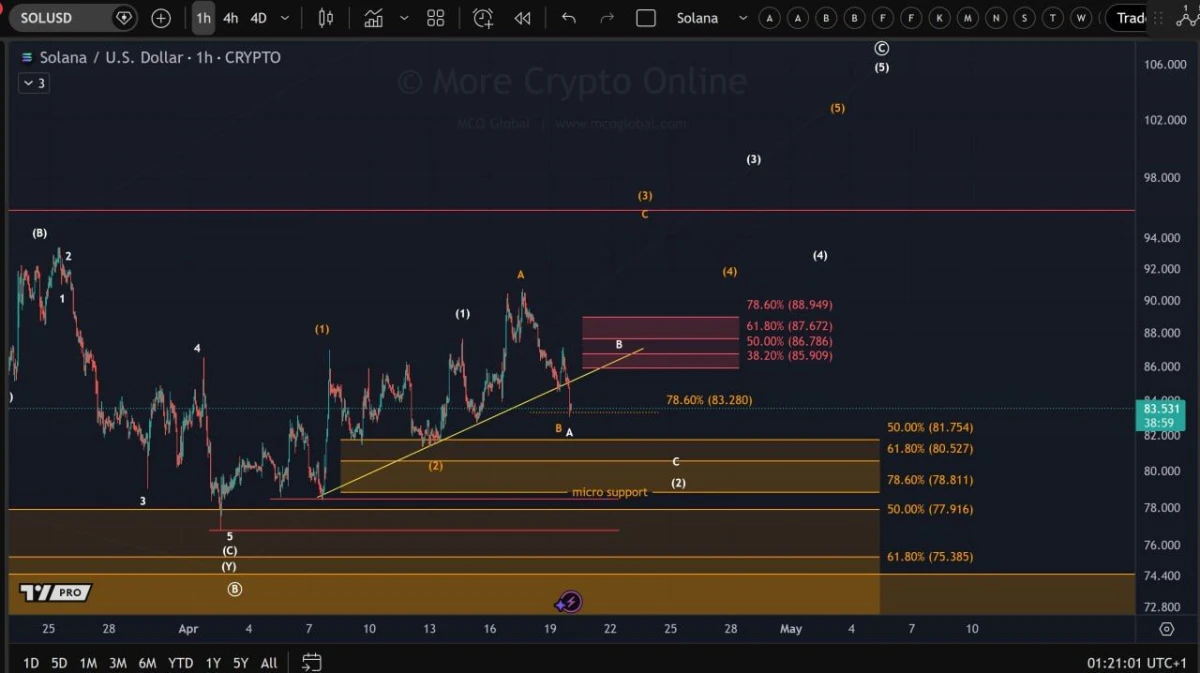
Solana / U.S. Dollar 1 Hour Chart. Source: More Crypto Online on X
That zone matters because it lines up with several retracement levels shown on the chart. The structure suggests this drop could still fit a wave two correction if buyers hold support and price stays above $78.81. The chart marks that level as the deeper invalidation point for the current bullish interpretation.
At the same time, the rebound setup remains incomplete. $SOL has already lost the rising short term support line, which signals weaker momentum. Therefore, traders will likely watch whether price stabilizes inside the marked support band or continues lower toward the high $78 area.
If support holds, the chart leaves room for another move higher after the correction. If $SOL breaks below $78.81, the current wave count would weaken and the broader pullback case would gain more weight.
Solana Reversal Setup Keeps Bulls in Control
BitGuru argues that Solana has shifted from breakdown fears to a cleaner recovery structure. The chart supports that view. It shows $SOL rebounding after the late March decline, then moving into a consolidation phase before breaking higher and pulling back without losing the broader recovery shape.
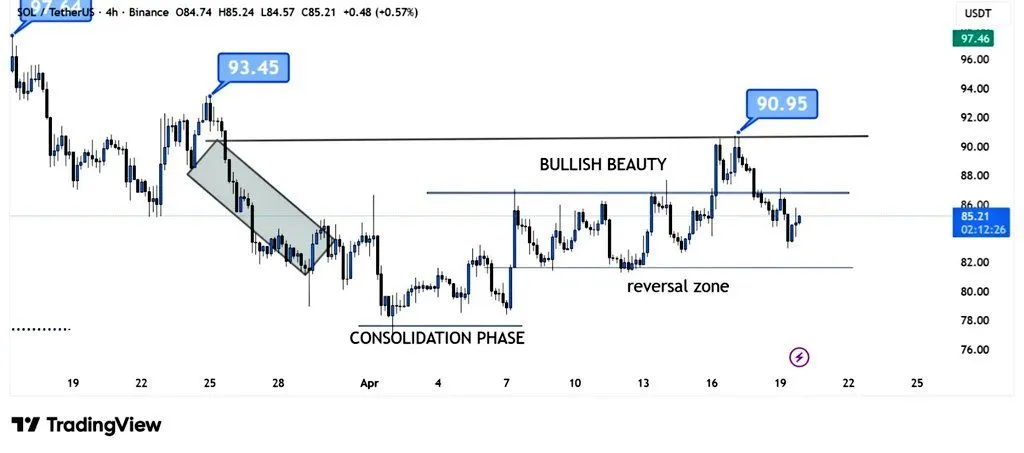
The key point is support. Price rejected from the recent high near $90.95 and moved back toward the mid range area around $85. However, the chart still shows $SOL holding above the marked reversal zone near $82. As long as that area stays intact, the pullback looks more like a retest inside an uptrend than a fresh bearish breakdown.
The earlier fall from around $93.45 formed the base for this structure. Since then, Solana has built higher lows and pushed into a stronger range. Therefore, the current dip does not yet cancel the bullish case. Instead, it suggests the market is testing whether buyers can defend support after the breakout.
If $SOL holds this zone, the chart keeps the door open for another move toward the recent highs. If support fails, the reversal setup would weaken and the bullish structure would need to be reassessed.