
Hyperliquid price is holding firm at $45 despite a modest dip, with record trading volumes suggesting its market momentum may only be getting started.
- Hyperliquid trades steadily at $45 while weekly gains remain intact.
- Spot and derivatives volumes surge, with BTC and ETH pairs driving activity.
- Technicals show consolidation, with a potential breakout forming above support.
Hyperliquid (HYPE) is showing resilience at the $45 mark, slipping 1% over the past 24 hours while keeping most of its weekly gains intact. The token has climbed more than 7% in the last seven days and is now trading 9% below its record high from mid-July.
Growing activity in the spot and derivatives markets is driving momentum. Trading volumes increased by more than half to $537 million in the last day alone.
Derivatives turnover increased to $2.65 billion, according to Coinglass data, while open interest decreased by 1%, indicating that traders are actively switching positions rather than exiting the market. This kind of churn often reflects consolidation, where short-term leverage resets before a new leg higher.
Hyperliquid breaks into the big leagues
Hyperliquid revealed on Aug. 26 that spot volumes on its exchange reached a new record of $3.4 billion in 24 hours. Much of that activity came from BTC and ETH pairs, with the platform now ranking as the second-largest venue globally for Bitcoin (BTC) spot trading.
Spot volumes on Hyperliquid reached a new 24h ATH of $3.4B. This was driven largely by growth in BTC and ETH deposits and spot volume, facilitated by @hyperunit.
— Hyperliquid (@HyperliquidX) August 25, 2025
This makes Hyperliquid the second largest venue to trade spot BTC across both centralized and decentralized…
The trend is backed by DefiLlama data, which shows monthly decentralized exchange volumes topping $16 billion in August, already well above July’s $11 billion. At the same time, the platform’s total value locked has climbed to $685 million, the highest in six months.
Hyperliquid technical analysis
The daily chart shows HYPE consolidating near its mid-Bollinger Band, just above $45. While this suggests stability, a breakout may be imminent given that the bands have started narrowing. The MACD displays a slight bearish crossover, suggesting short-term caution, while the relative strength index is neutral at 52, indicating balanced momentum.
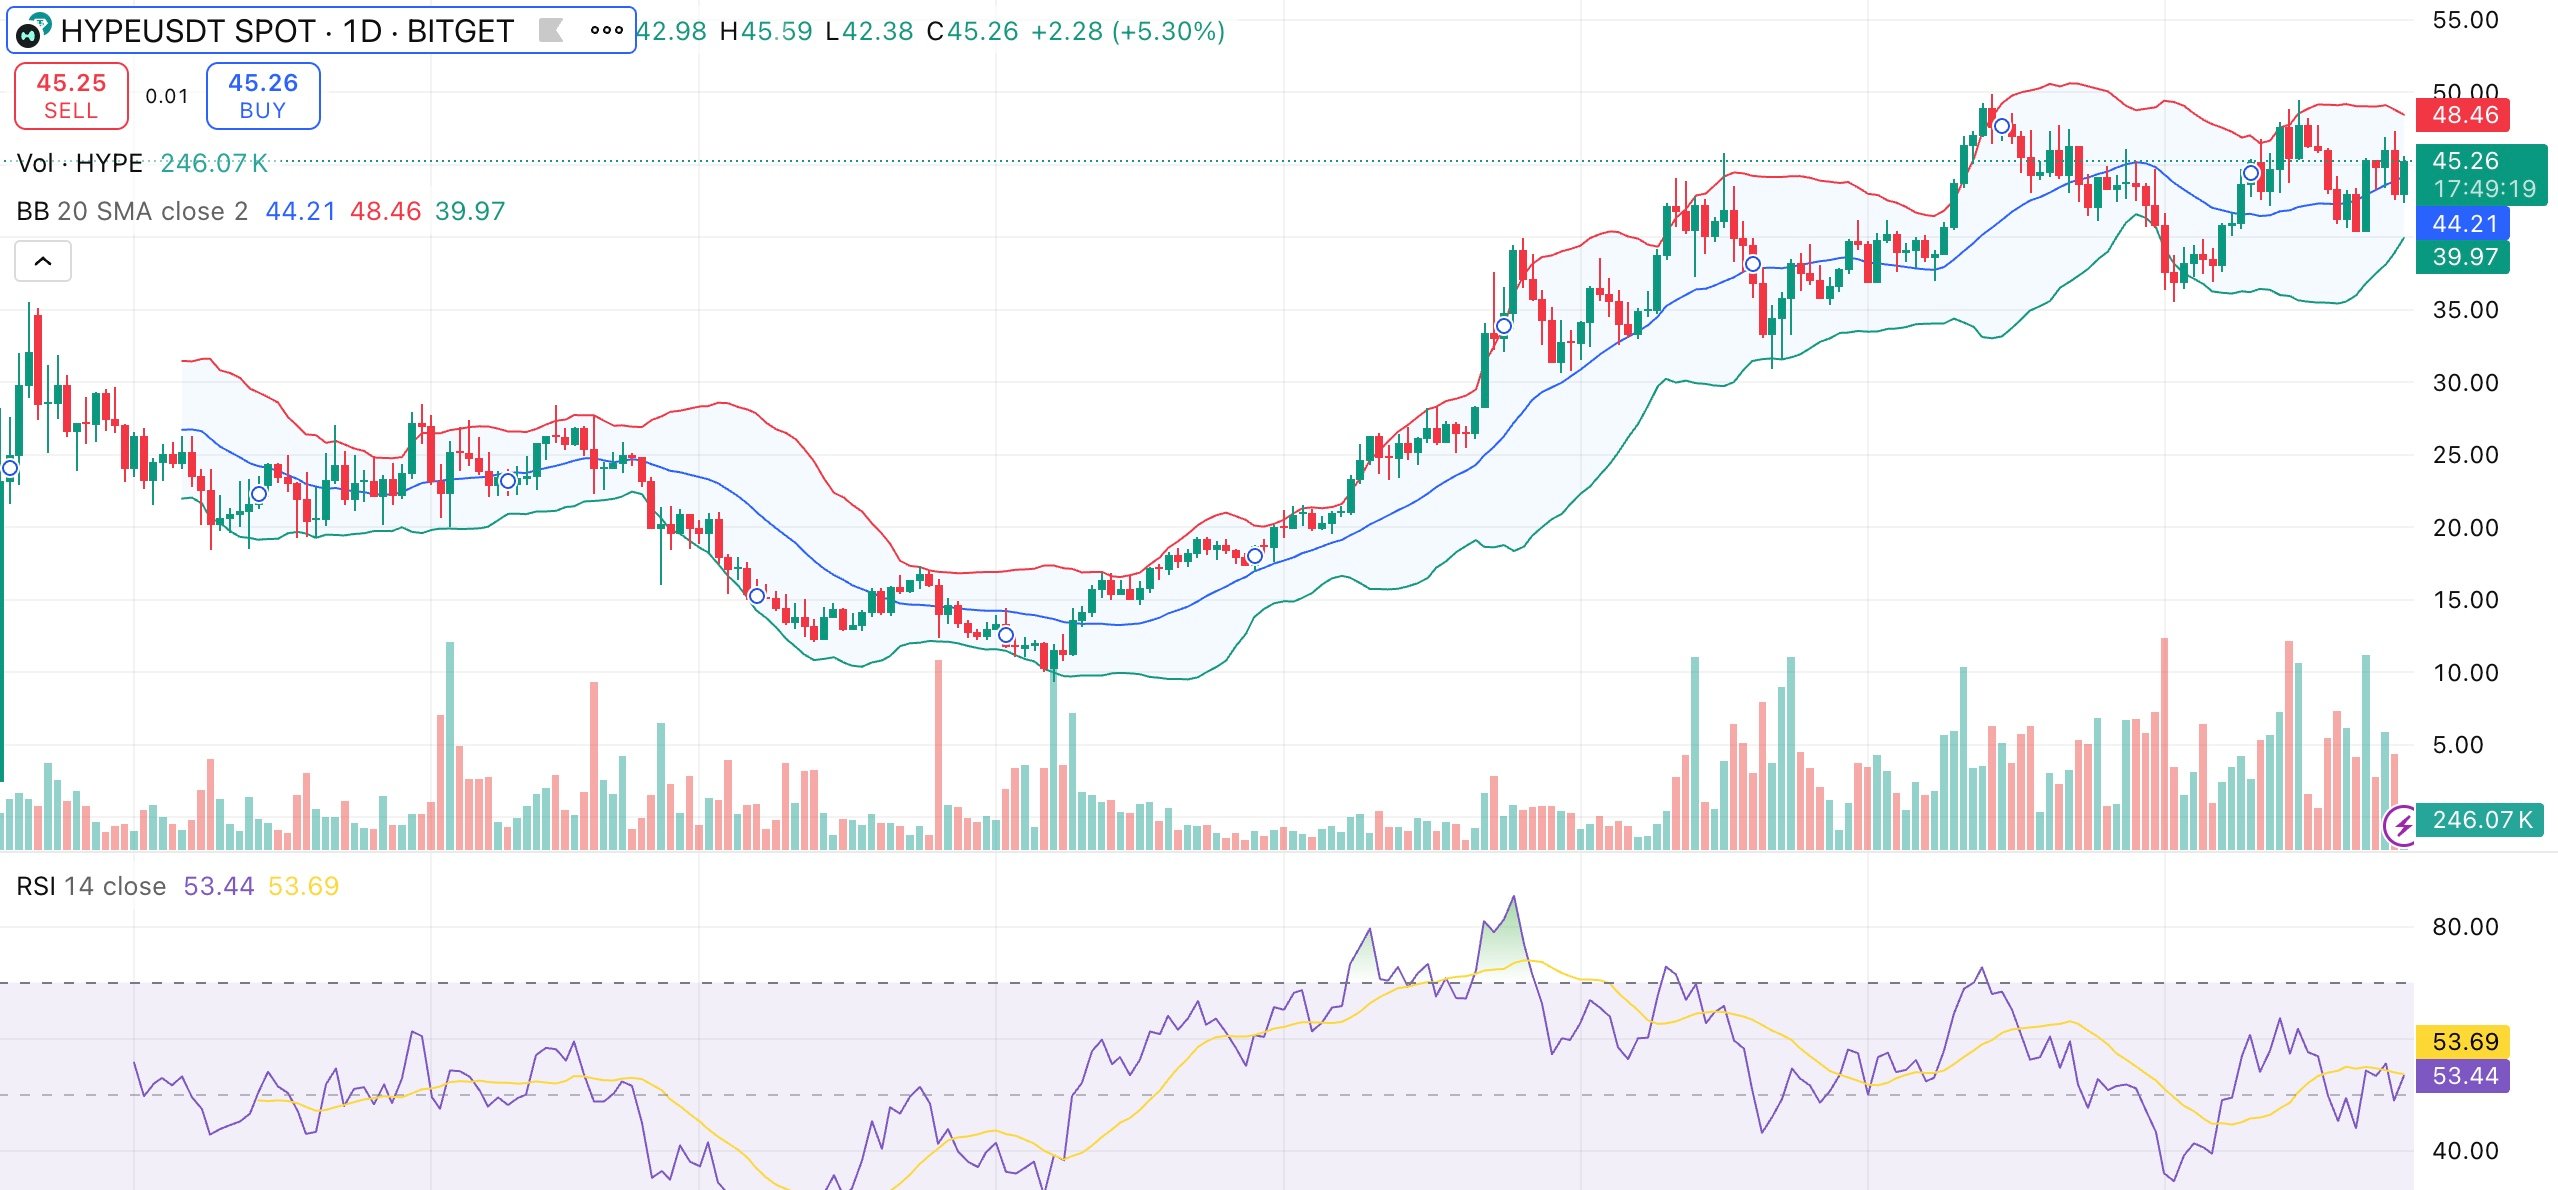
Moving averages tell a stronger story. From the 10-day EMA ($44.16) through the 200-day SMA ($29.32), every key moving average currently flashes buy signals, reflecting an intact uptrend structure.
If the $45 level holds, buyers could drive a move toward $48.50 and potentially back to July’s peak near $50. Failure to hold the $44 support (mid-band) risks a drop toward $40.50, the lower bound of its 7-day range. A break below that could trigger broader downside pressure.