The NEAR coin price continues to resonate within the crucial 200 and 100-day EMAs. Will sellers drive down the 200-day EMA? The Near Protocol was developed through the community, which is updating the original code and is releasing updates to the ecosystem. The goal stated by the community is to create an infrastructure that is "secure enough to manage high-value assets like money or identity and performant enough to make them useful for everyday people." Let us move ahead to read about Near Protocol technical analysis.
Past Performance of NEAR
The NEAR coin price shows a consolidation move below the crucial horizontal zone of $12 and $10 in the daily chart. Moreover, the price action shows long-tail formation close to the $10 mark indicates lower price rejection. 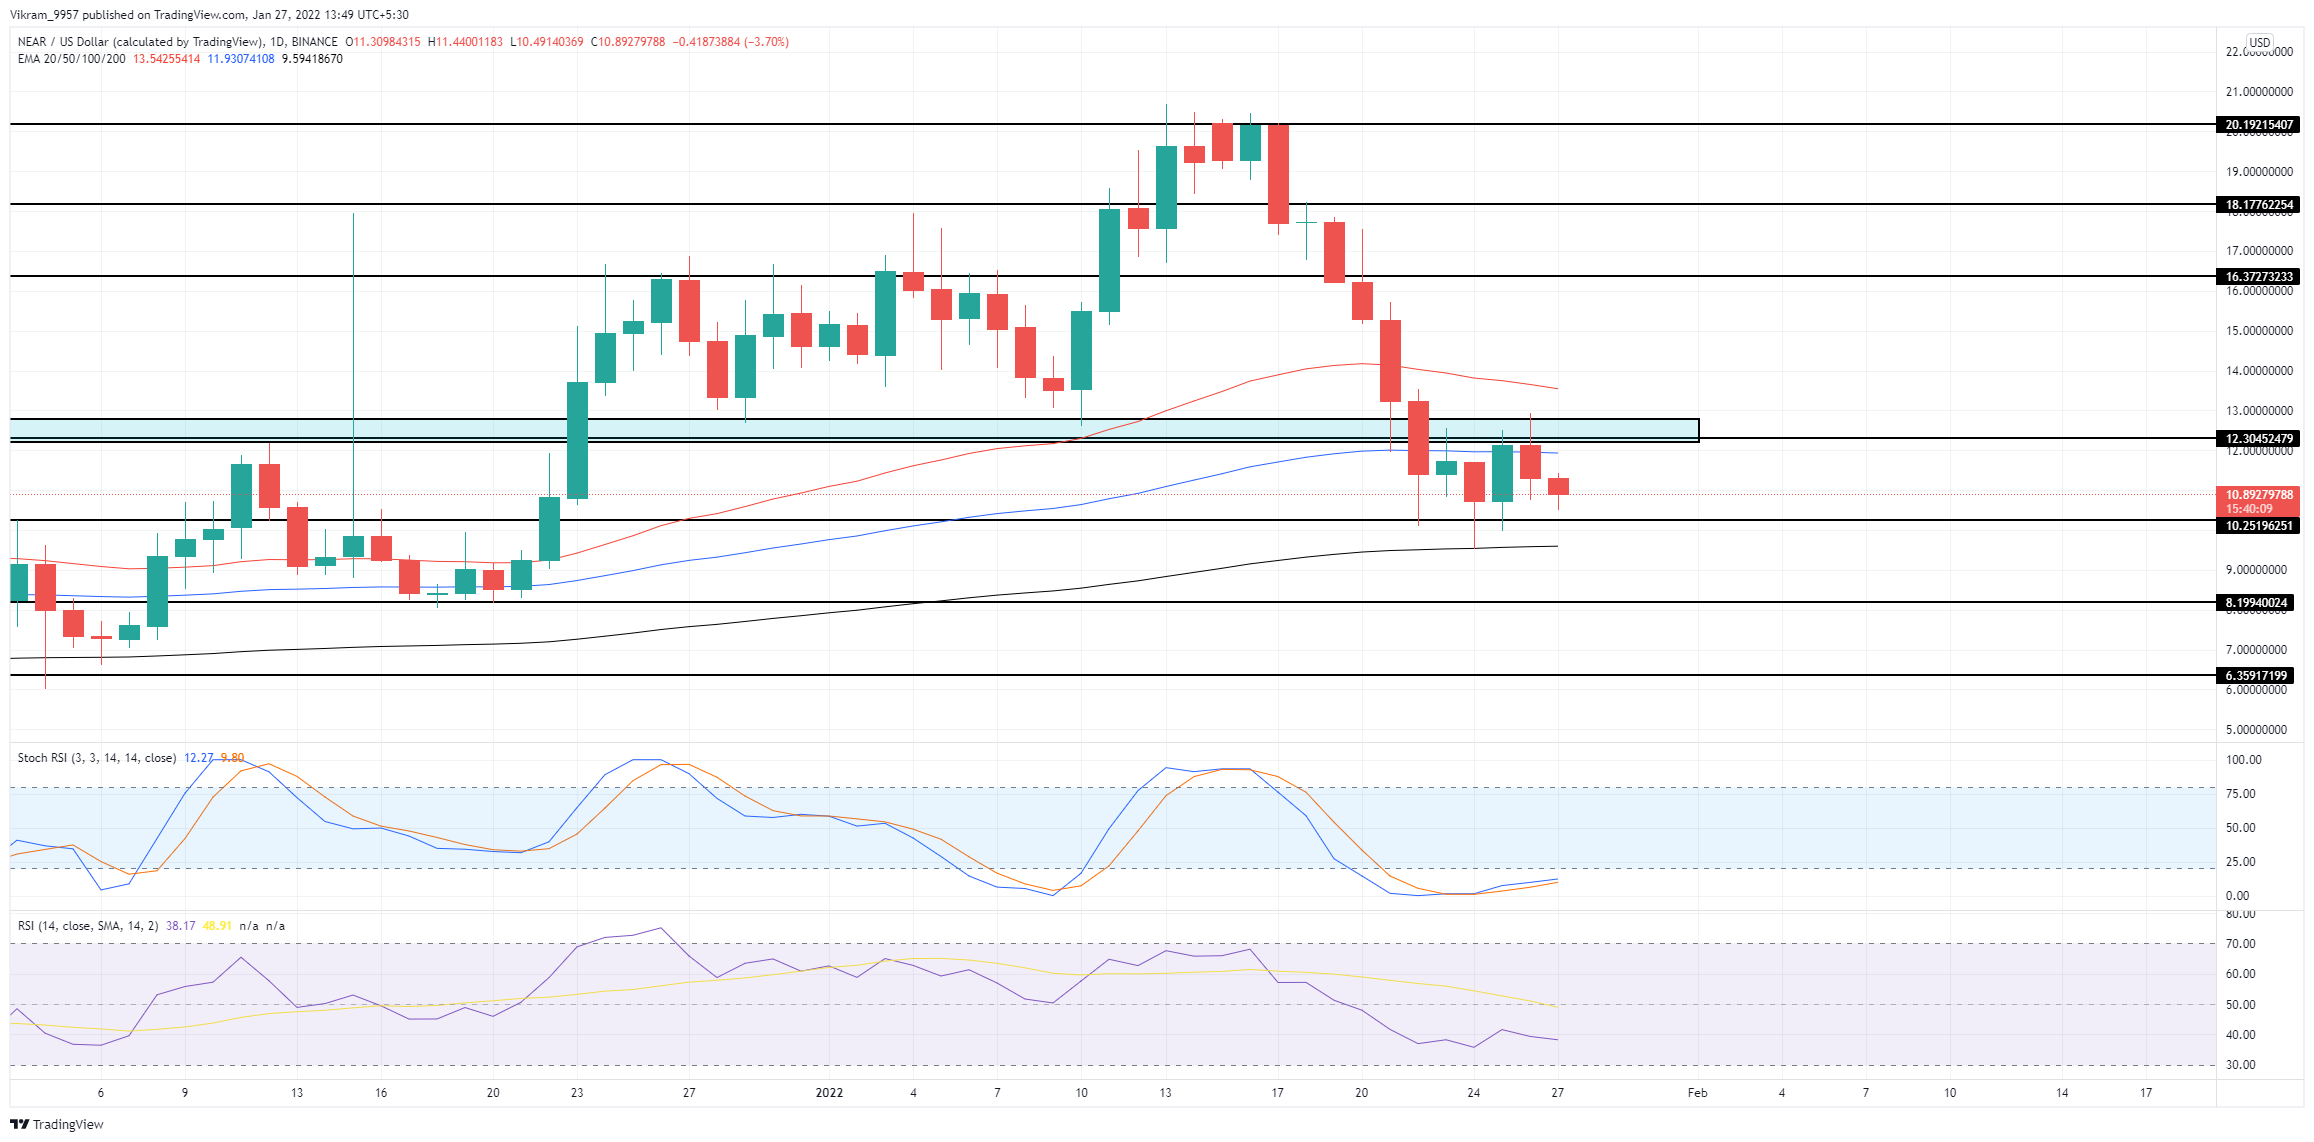 NEAR/USD Daily Chart
NEAR Technical Analysis
The previous bullish attempt by the NEAR coin price failed to rise above $12 resulting in a downfall of 8.14%. Moreover, the 20% fall in the intraday trading volume reflects the bullish failure. The crucial Exponential Moving Averages maintain a bullish alignment with the 200-day EMA providing dynamic support. However, the sellers at the 100-day EMA fuel the consolidation range. The Stochastic RSI Indicator shows the rising K and D lines attempting to exit the oversold zone. However, the increasing proximity of the lines increases the chances of a bearish crossover. The RSI Indicator at 38% shows the slope sustaining below the central mark in the daily chart. Moreover, the 14-day SMA breaks below the 50% line, reflecting a solid underlying bearishness. Therefore, the technical indicators reflect the momentary growth in bearish trend momentum. However, the dynamic support of the 200-day EMA to NEAR coin might result in a bullish breakthrough.
Upcoming Trend
The NEAR coin price continues the sideways movement within the crucial 200 and 100-day EMAs in the daily chart. Therefore, closing below any of the EMAs will generate an entry spot for traders. Buyers can observe the price reach the target of $13.5 in case of a bullish breakout above the consolidation range. However, the fallout of the accumulation zone will drive the prices below the 200-day EMA to $8.5. At the time of writing, TradingView sustains a bearish view for the NEAR token and gives a "SELL" signal.