
As of April 26, 2024, bitcoin continues to exhibit fluctuating fortunes, with the latest trading session closing at $64,095. Amid a wider range between $62,923 and $65,069 over the last 24 hours, traders are grappling with mixed signals across various technical charts and indicators.
Bitcoin
Bitcoin’s oscillators are predominantly neutral with the relative strength (RSI) index at 46 and other indicators like the Stochastic and commodity channel index (CCI) hovering around similar levels, suggesting a lack of clear directional momentum. Meanwhile, moving averages (MAs) paint a more pessimistic picture, signaling bearish sentiment across most short-term periods such as the 10, 20, 30, and 50-day averages, despite some bullish signals from the longer-term 100 and 200-day averages.
The 1-hour $BTC/USD chart shows significant volatility without a definitive trend, as price action remains confined within a tight trading range. For short-term traders, entering near the lower range at approximately $62,000 could be considered, leveraging this level as a potential support zone. Conversely, taking profits near the resistance at $66,000 could be prudent, aligning with past price behavior where this threshold acted as a strong barrier.
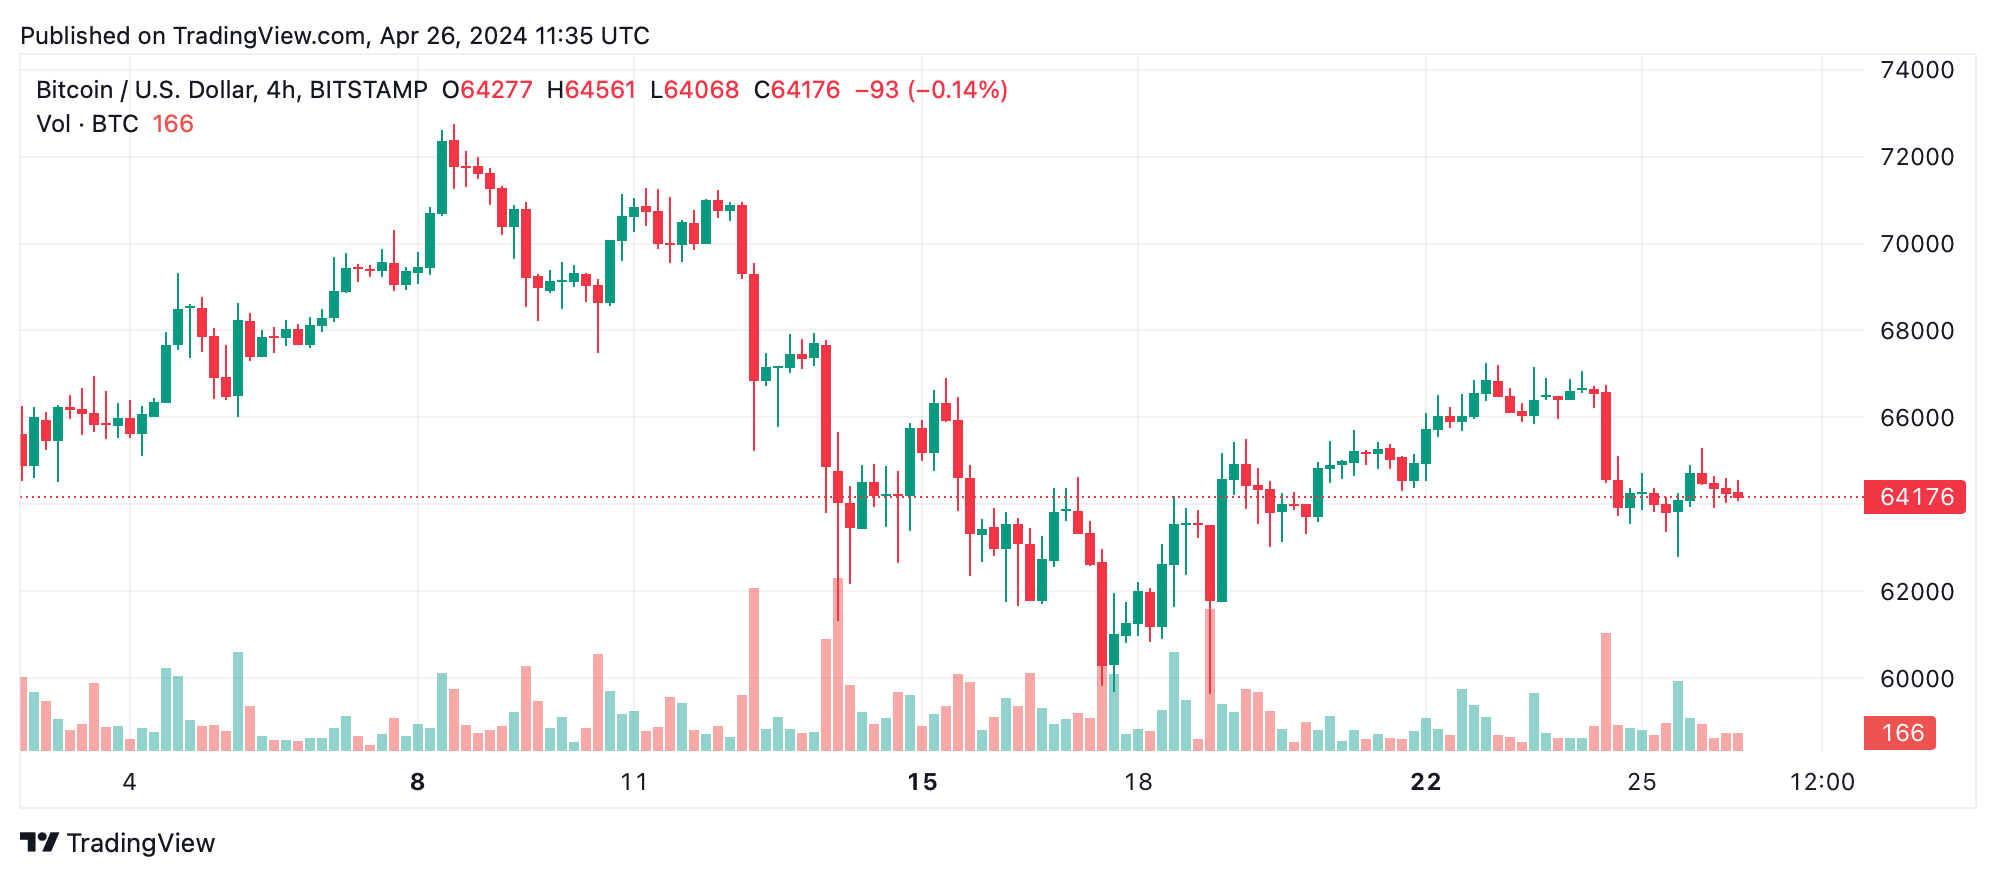
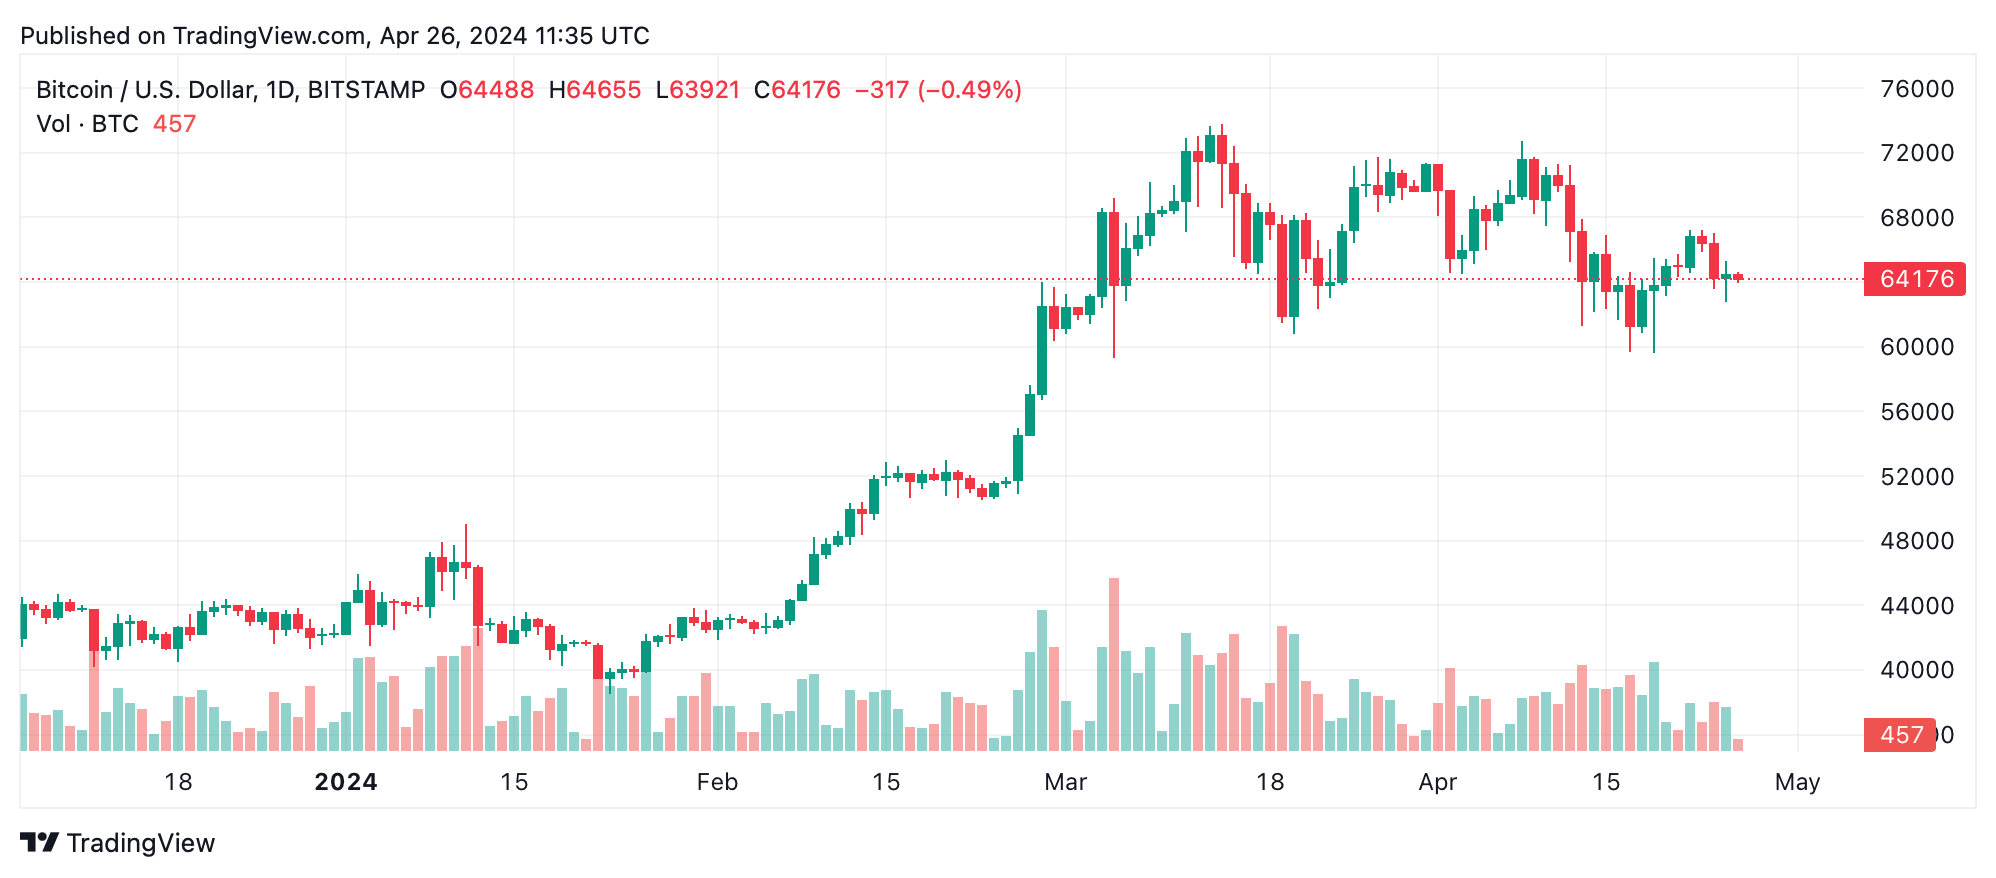
In a more extended view, the 4-hour and daily charts emphasize a persistent downtrend. The 4-hour analysis reveals a series of lower highs and lower lows, a bearish indicator that was punctuated by sharp sell-offs. The daily chart confirms this trend, indicating substantial resistance at the $72,000 level which $BTC has struggled to overcome. Long-term traders should remain cautious, possibly waiting for a confirmed bullish reversal before committing to significant positions.
Bull Verdict
Should bitcoin break above the resistance level at $65,391 and sustain this upward movement, it would indicate a significant reversal from the prevailing bearish trend. Such a breakout could propel $BTC towards a bullish phase, with the potential to reach a near-term target of $70,000. Traders should monitor for sustained movements above this key resistance, as it would suggest an increasing momentum and a possible shift in market sentiment towards optimism.
Bear Verdict
The consistent bearish signals across most MAs, coupled with a lack of strength in the oscillators, suggest that the bearish trend may persist in the near term. With resistance solidly forming at lower levels than previous highs and significant selling pressure evident, $BTC could likely test further downsides, potentially approaching the next main bearish target at $60,000. Traders should remain cautious, considering safeguarding assets and preparing for possible further declines in price.