cryptopolitan.com

- Chainlink price down 4 percent on the day to move below $20.27
- Trading volume dipped 15 percent to paint bearish outlook
- Price does however present buying opportunity before launching towards $30
Chainlink price analysis for the day shows a bearish picture, as price moved below the crucial 25 and 50-day exponential moving averages (EMAs) to a low of $19.72. Trading volume also dipped more than 15 percent, as $LINK gave up on the 41 percent increment made from the December 15 swing low. Price currently sits at $20.29, providing a discounted entry for buyers to come into the market. The current outlook for $LINK presents a long setup for a buy stop order at $22.50 and a profit target at $35 with a stop loss at $20.50. This trade setup would aim to provide a 6:5:1 reward.
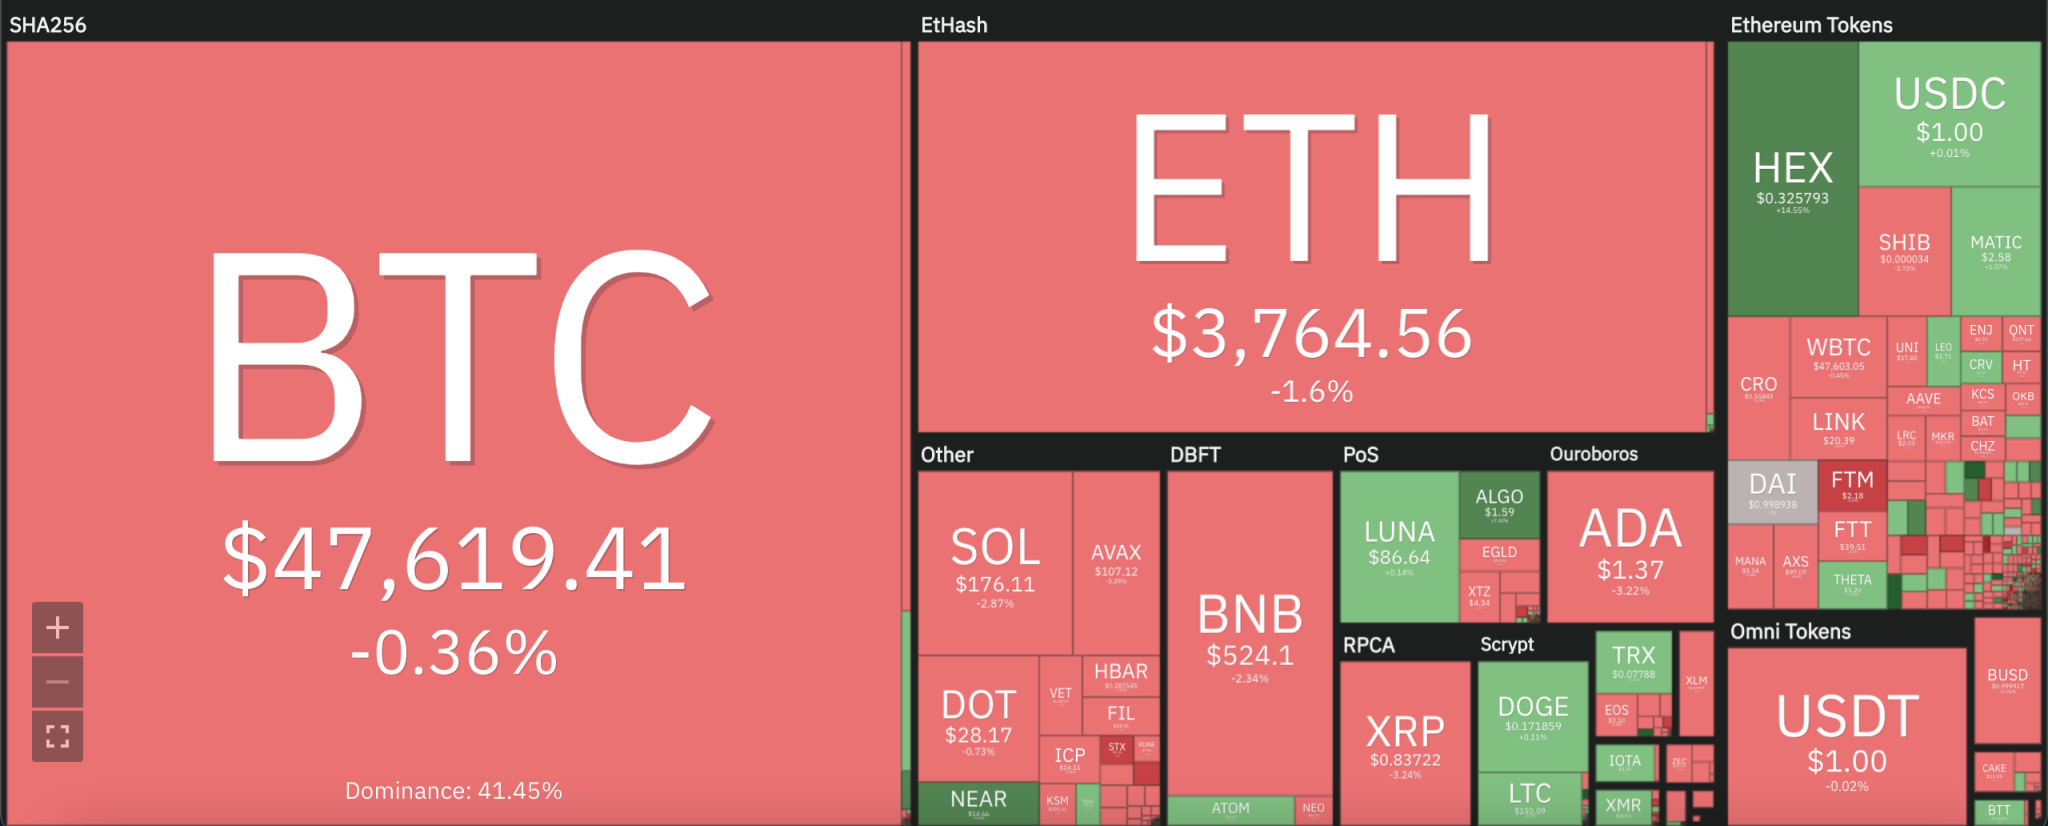
The larger cryptocurrency market continued to bleed over the last 24 hours, with Bitcoin dropping down to $47,630 and Ethereum dropping almost 2 percent to sit at $3,763. Among Altcoins, Solana, Ripple and Cardano all declined 3 percent each, while Terra, Dogecoin and Litecoin made minor increments.
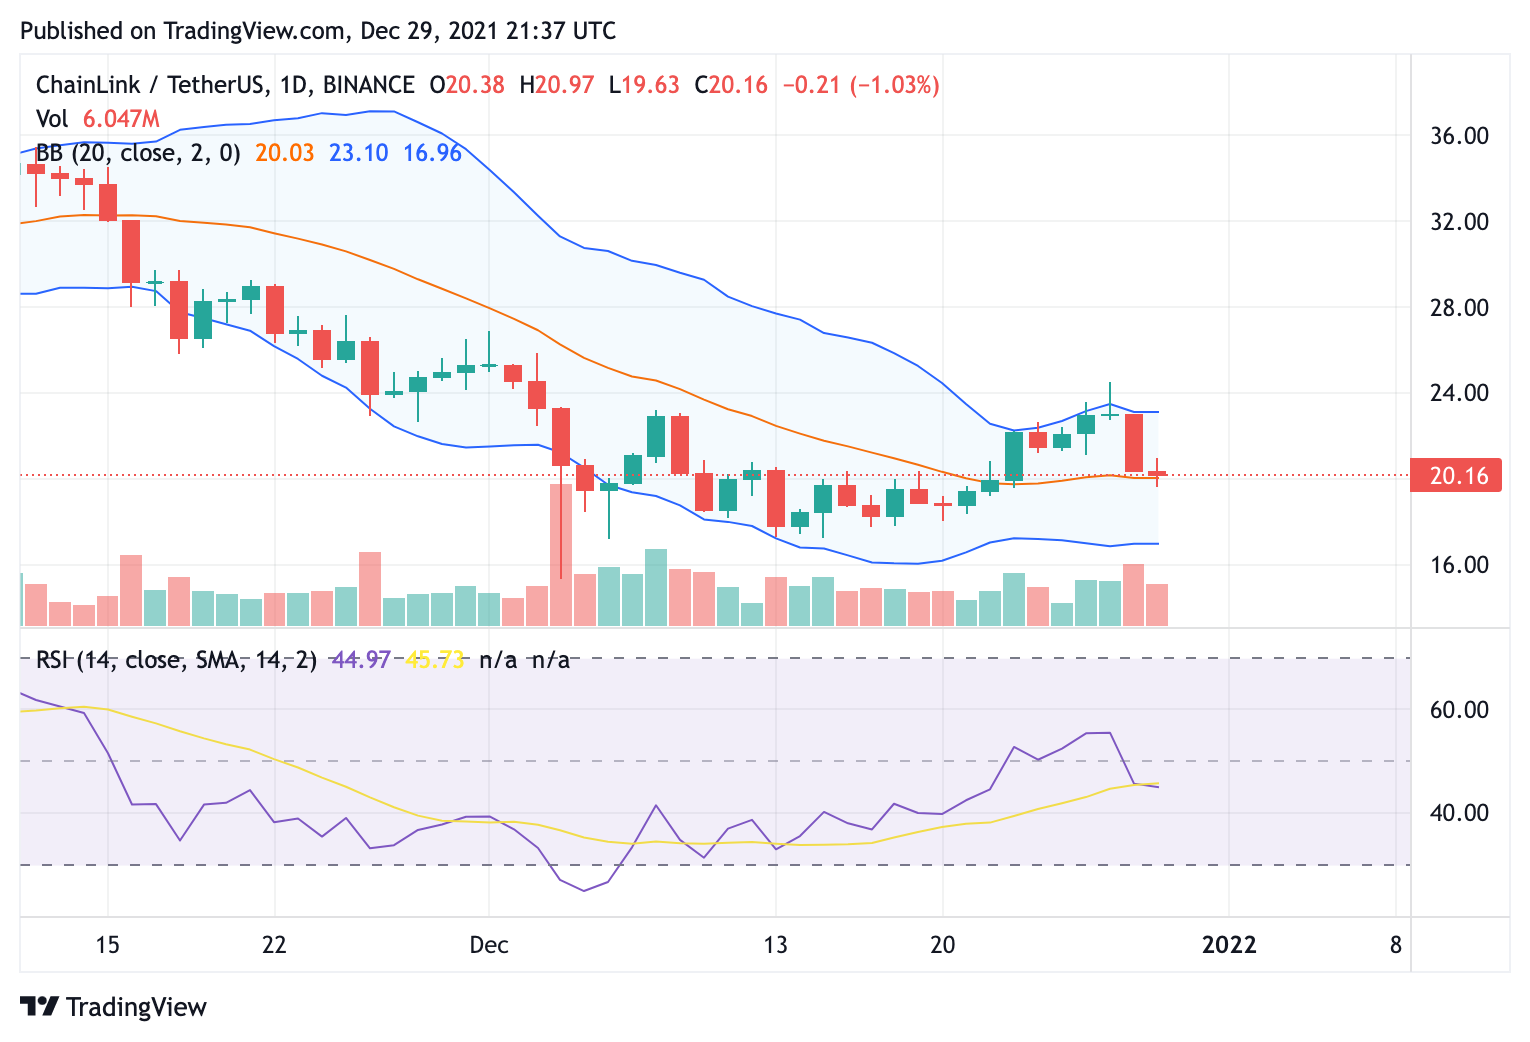
$LINK/USD 24-hour chart: Pole pattern suggests hypothetical upturn from current dip
The 24-hour chart for Chainlink price analysis shows a pole pattern, that indicates a potential subsequent rise from the current trend. The Relative Strength Index (RSI) value of 45.23 also shows some encouragement in terms of market valuation, if $LINK can garner more impetus over the coming days. Having moved below the crucial EMAs, $LINK price has just moved into the lower half of the Bollinger Bands’ curves, suggesting that there is further pullback to come.
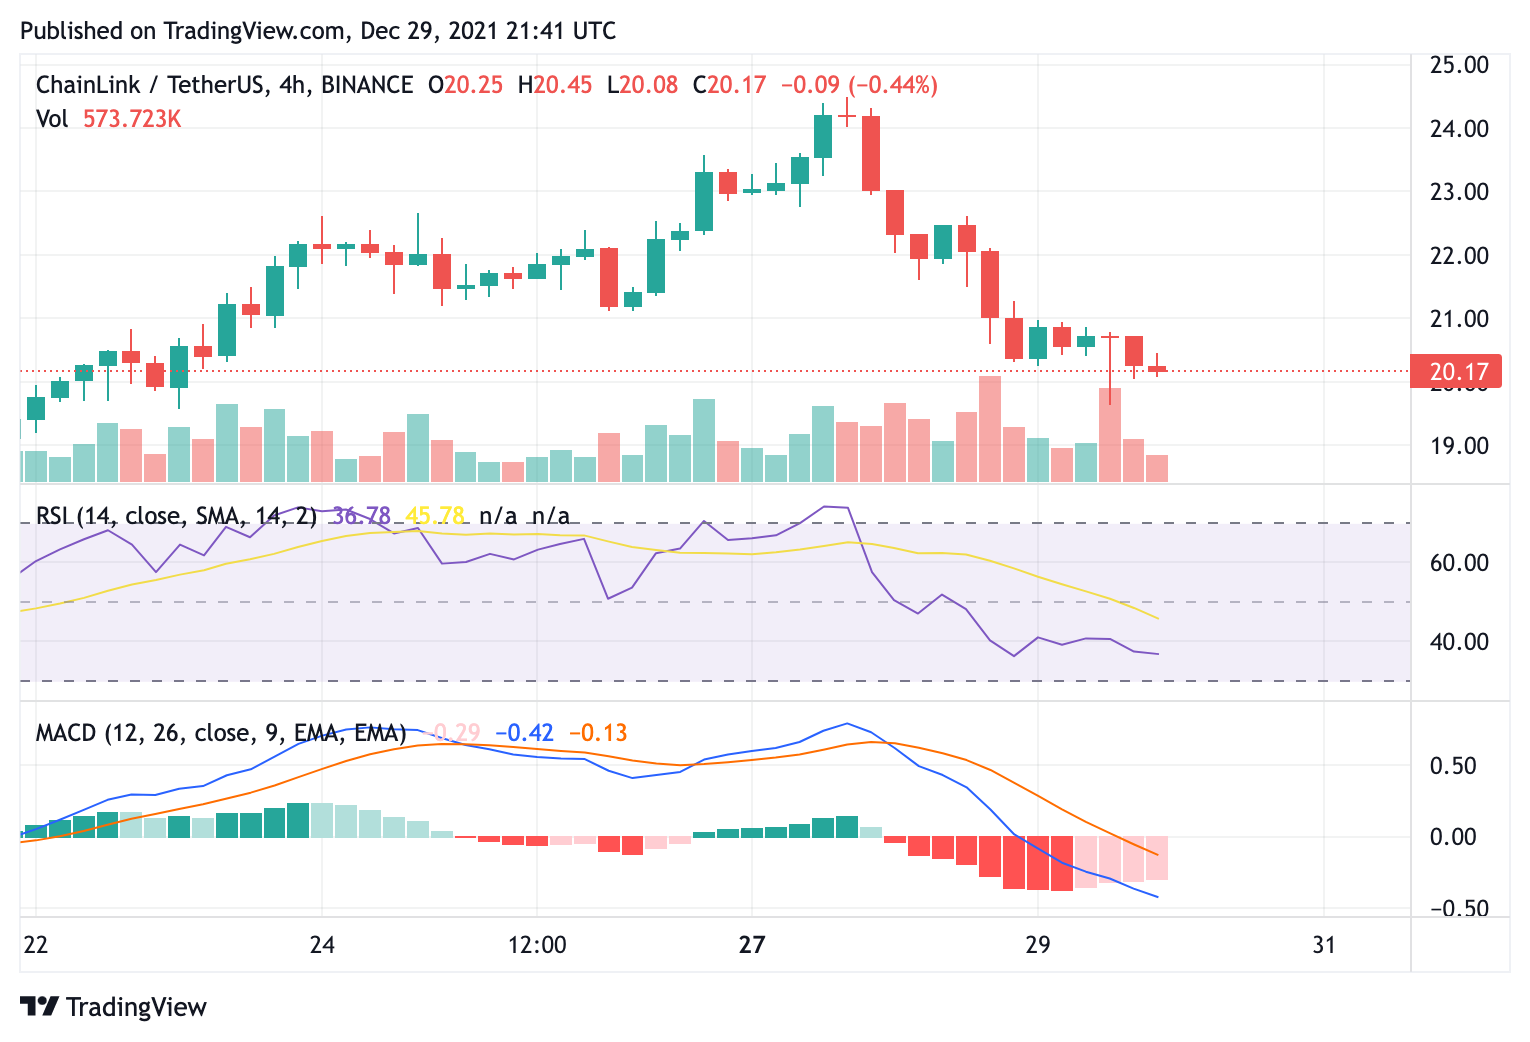
$LINK/USD 4-hour chart: Price set to test $18 support
On the 4-hour chart for the $LINK/USD trade pair, price can be seen in free fall after the day’s decline and could be in line to drop as low as $18 over the coming short-term trade. The 4-hour RSI shows a bleak market valuation of 36.64, while the Moving Average Convergence Divergence (MACD) curve also sits well below its neutral zone and the 0.00 mark. These indicators confirm that $LINK is set to test the support floor at $18 and could well be in line to move down to July high of $16.74.