Bitcoin’s (BTC) and top-ranking cryptocurrencies like Ethereum (ETH), Binance Coin (BNB) and others stagnate in price as the price of Bitcoin (BTC) plunged below $26,000, raising a more alarming situation of price retesting $24,000.
The general cryptocurrency market has suffered a price decline for the past few weeks as uncertainty, fear, and greed index indicate many traders and investors have yet to determine the next bullish scenarios for BTC.
Despite the market suffering a shocking decline in price, there are top cryptocurrencies that have defiled the odds as the likes of CYBER rallied by over 600% in a few weeks, with the likes of TRB, ID, and NRM all showing similar strength ahead of a new week.
Data analytics from Coin360.com shows that the market is more dominated by the bears except for a few special top 5 cryptocurrencies (CYBER, SHIB, XRP, ADA, TRB), outperforming Bitcoin and others to the highest degree.
The price of Bitcoin rallied to a high of $28,200 as bulls attempted to reclaim its price above $28,500, acting as resistance for the price. Bears instantly rejected the price above $28,200, indicating a fake pump for Bitcoin as bears pushed the price below $27,400.
The price of BTC bulls suffered more shock as bears continued to show their dominance, pushing the price below $26,500 as the price looked set to retest key regions of $24,000 or $23,700 as bulls will be eyeing to push the price of BTC higher.
Bitcoin (BTC) currently trades below the 50-day and 200-day Exponential Moving Averages (50-day and 200-day EMA), indicating a more bearish grip on BTC price as $24,000 looks more realistic for bulls to open buy orders as this region signifies key demand region in the past.
The Moving Average Convergence Divergence (MACD) on the daily timeframe for BTC bears shows that the price remains in favour of bears as the Relative Strength Index (RSI) looks oversold, and the price could make a trend reversal soon.
Ethereum’s price action hasn’t been encouraging either as the price of Ethereum (ETH) suffered price rejection by bears at a region of $1,750 as the price of ETH currently trades below its 50-day and 200-day EMA indicating more bearish price action for ETH bulls.
If the price of ETH bulls closes below $1,600, we could see bears pushing prices to a low of $1,500 and even $1,450 as these regions look stronger to hold sell-off by bears.
Major cryptocurrency players continue to stall in their price movement; let us consider some weekly top 5 cryptocurrencies (CYBER, SHIB, XRP, ADA, TRB) that will continue to outshine Bitcoin and areas you should be looking to buy in.
CyberConnect (CYBER) Price Analysis as Top 5 Cryptocurrency to Watch
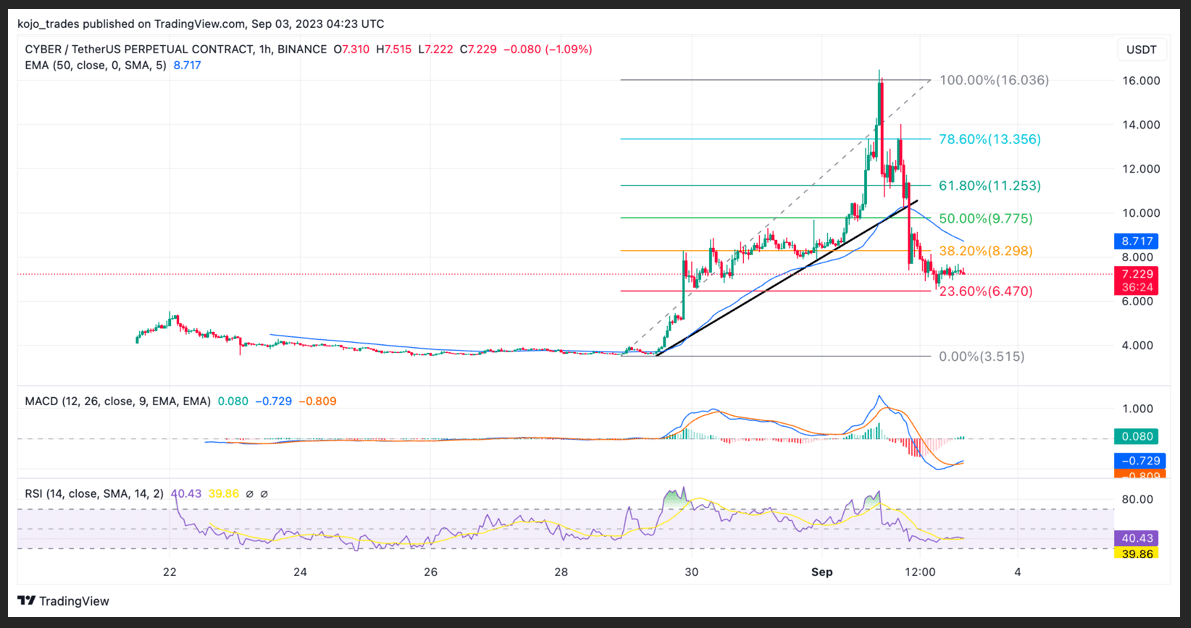
CyberConnect (CYBER), a social network token, remains a huge task for many traders and investors as the price of CYBER/USDT rallied by over 600% in less than a week, creating so much profit returns for its holders as this great token remains the best performer of the week.
The price of CYBER/USDT, after its list on big exchanges, formed a base support of $3.8. The price broke out above its 50-day EMA, indicating bullish price action as the price rallied to a high of $16 before suffering minimal price rejection.
Onchain data shows an extreme rise in volume for this crypto token as many traders and investors are looking to buy into this new trend as CYBER mimics the likes of Friend.tech and X (formerly Twitter) as a cryptocurrency social token.
The price of CYBER needs to hold above $7.1 to maintain its bullish position as this region corresponds to a key support and demand zone of 50% Fibonacci Retracement value (50% FIB Value).
If the price breaks below this region of $7.1, this could mean bears have taken full control as the most likely region for buy orders will be around $4.5. With the CYBER token trending as the new hype in crypto, we could see the price revisit $10.5-$11.7.
MACD and RSI for CYBER/USDT point to more bullish price action in the coming weeks, as this token has demonstrated an extreme price rally of $16.8 despite Bitcoin uncertainty.
Major CYBER/USDT support zone – $16.8
Major CYBER/USDT resistance zone – $7
MACD trend – Bullish
Shiba Inu (SHIB) Price Analysis on the Daily (1D) Timeframe
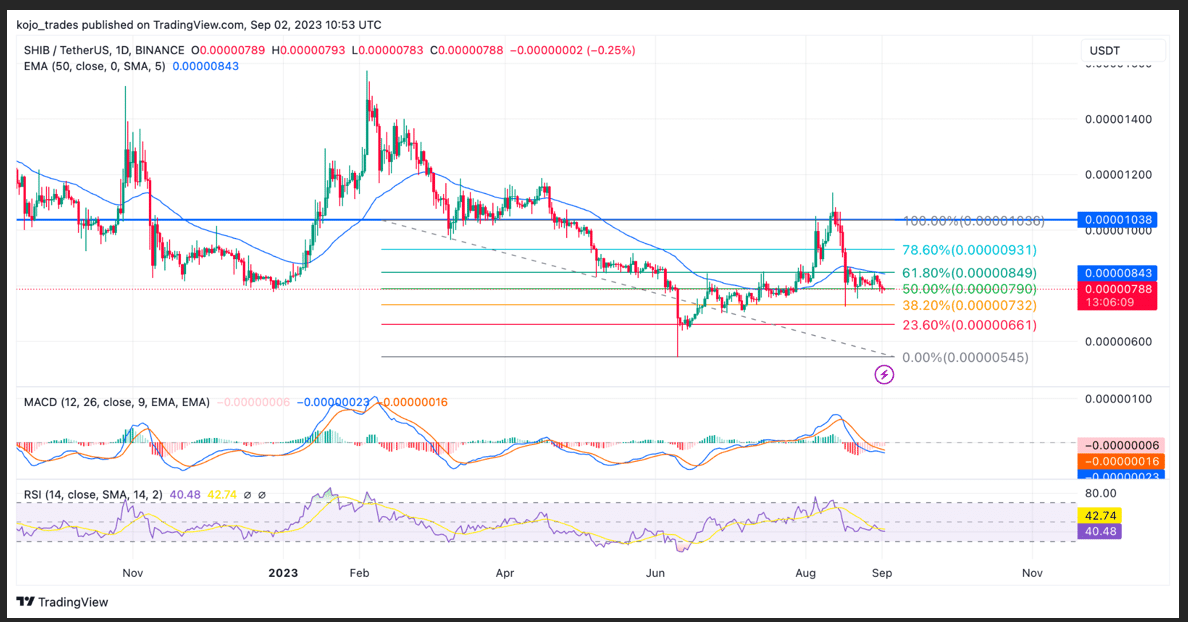
Shiba Inu (SHIB) price has remained strong after suffering a bearish price decline from a high of $0.00001100 after its successful breakout from a bullish triangle to a high of $0.00001100.
SHIB/USDT has struggled to replicate its bullish price action as the famous meme token trades just below its 50-day EMA and above 50% FIB value, highlighting bulls still have a chance of flipping the current trend of SHIB into a bullish trend.
Despite its MACD and RSI daily trend showing bearish, the price of SHIB/USDT trading above 32.8% of its FIB value, which corresponds to a support zone of $0.00000730 as a good entry to open long positions and for investors to buy into this token.
If the price of SHIB/USDT rallies above $0.0000850, we could see a bullish trend as the price will trade above its 50-day EMA. A close above this region could only mean the SHIB army is back to drive the price higher to $0.00001100 – $0.00001200.
Major SHIB/USDT support zone – $0.00000750
Major SHIB/USDT resistance zone – $0.0000850
MACD trend – Bearish
Ripple (XRP) Price Analysis as a Top 5 Cryptocurrency to Watch
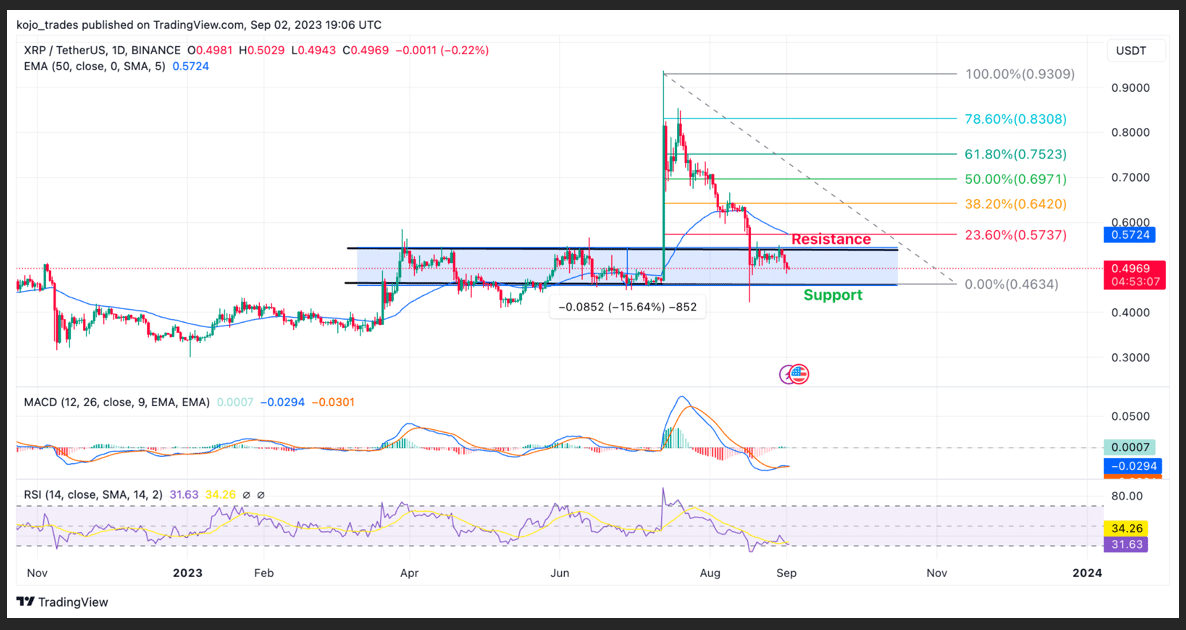
The road to $1 for XRP/USDT remains uncertain despite seeing increased on-chain activity and rising engagement within the XRP ecosystem, highlighting high demand for this token as the price of XRP in July of 2023 rallied to a high of $0.94 as news spread of its lawsuit victory.
The price of XRP/USDT suffered price rejection from a high of $0.93 as bears continued to push the price of XRP in a downtrend as its lawsuit victory had little to no effect on the price of XRP.
XRP/USDT has found its price remained in a range price movement for weeks now as the price of XRP struggles to break past its resistance of $0.55 as bears have rejected its several attempts.
The daily price chart for XRP/USDT suggests the price could continue in its downtrend to a region of $0.45, acting as a key demand zone in the past where traders and investors would be looking to buy more into XRP.
XRP/USDT trades below the 50-day and 23.6% FIB Value as the price of XRP/USDT has had close to a 100% price retracement after its initial pump to a high of $0.94.
The MACD and RSI for XRP look bearish as bears continue to dominate the price of XRP, with both indicators suggesting the price could go lower in the coming days or weeks.
Major XRP/USDT support zone – $0.45
Major XRP/USDT resistance zone – $0.55
MACD trend – Bearish
Tellor (TRB) Daily (1D) Price Analysis
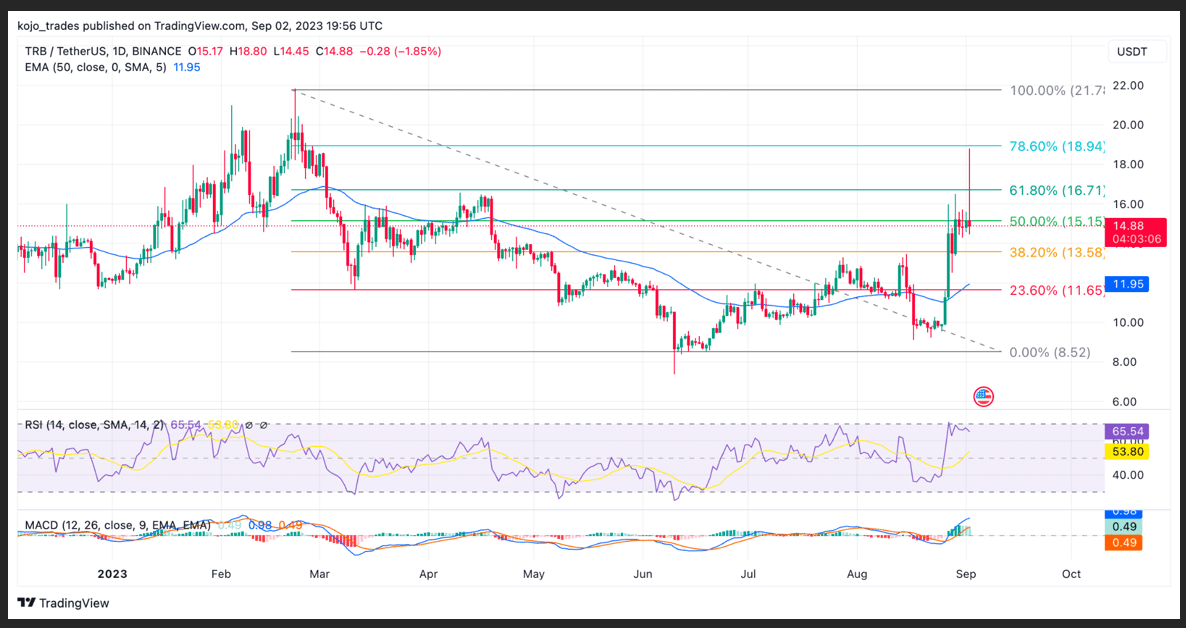
Tellor (TRB) remains a top performer as its price action looks bullish heading into a new week. Despite not racking a high-profit percentage of 100%, TRB/USDT continues its bullish price action as price eyes $20.
The price of TRB/USDT in the past few weeks has struggled to reclaim bullish price action as the bears continue to sell the price of TRB/USDT to a region of $9. After forming strong support, the price broke with strong momentum to a high of $18.
The price of TRB/USDT reclaimed the 50-day EMA, acting as support for TRB/USDT price as the price of TRB eyes a rally to the high of $20. The price was initially rejected by bears around the 78.6% FIB value acting as resistance.
TRB/USDT trades above the 50% FIB value and the 50-day EMA, suggesting a more bullish price trend could be possible.
TRB’s MACD and RSI values indicate a bullish price trend, as bulls would look for more opportunities to increase prices.
Major TRB/USDT support zone – $13.6
Major TRB/USDT resistance zone – $20
MACD trend – Bullish
Cardano (ADA) Price Analysis as a Top 5 Cryptocurrency to Watch
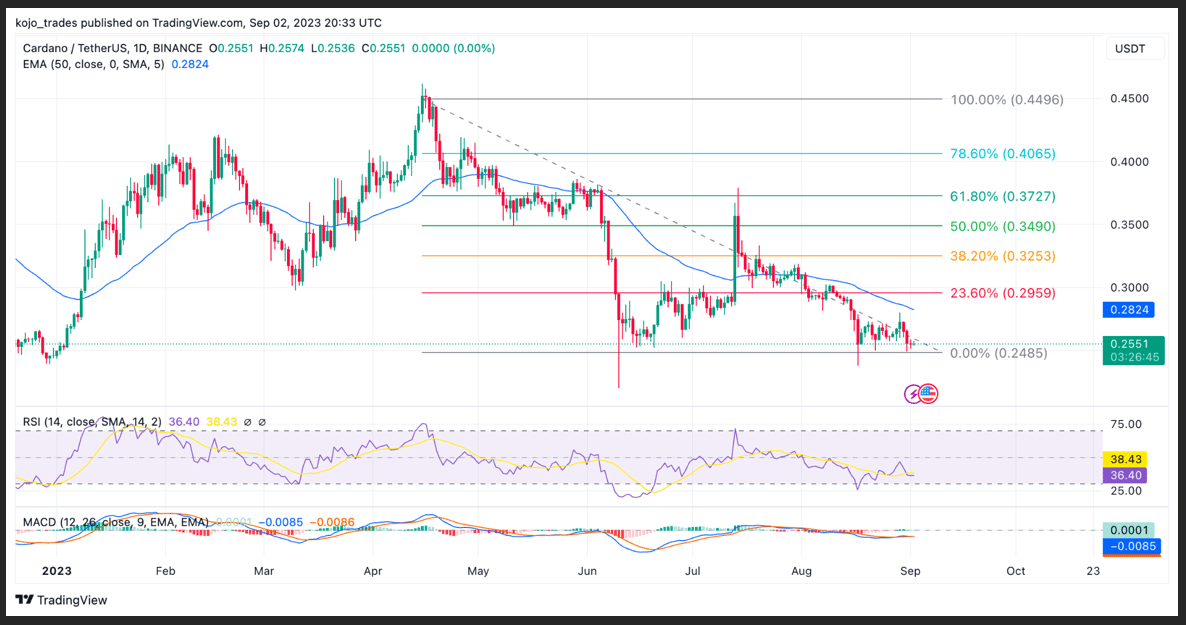
It is no news that Cardano (ADA) has been termed a Bitcoin and Ethereum killer due to its design and use case. The price of ADA/USDT has failed to meet up to its hype as ADA/USDT has struggled to show any signs of bullishness.
After rallying to a high of $0.45, the price of ADA/USDT has struggled in the hands of the bears as the price of ADA continues to nuke down from its yearly high of $0.45 to a yearly low of $0.255.
The price of ADA/USDT currently trades at the demand zone, where traders and investors will be looking to buy more ADA for a quick price gain. A bullish price rally from this region could see ADA retesting $0.28, acting as resistance and corresponding to the 50-day EMA.
ADA’s price needs to hold this region of demand zone to avoid bear pushing the price of ADA/USDT lower. If bulls hold the price, we could see a minor price bounce for ADA price.
Major ADA/USDT support zone – $0.280
Major ADA/USDT resistance zone – $0.255
 thecryptobasic.com