The fifth-largest cryptocurrency by market cap, Bitcoin Cash (BCH), recently dropped to levels not seen in its 3-year history. Still, a particular technical pattern suggests it is time to buy.
BCH Hits New All-Time Lows
Bitcoin Cash’s major proponents have done everything in their power to expand the utility of this altcoin and overthrow Bitcoin from its 11-year reign as the leading cryptocurrency. The attempts have been varied, from increasing the block size limit to misleading crypto enthusiasts into buying BCH instead of BTC.
It now appears that these efforts have been in vain.
Bitcoin Cash has failed to spark interest among investors as well as some of the token’s most hardened advocates. Even Roger Ver’s mining pool, one of the leading figureheads behind the coin, almost entirely stopped mining BCH.
Today, the Bitcoin spinoff has a negative year-to-date (YTD) return of nearly 47% against the U.S. dollar. The losses are less grave when considering the BCH/BTC trading pair, which only posted a negative YTD of 35%.
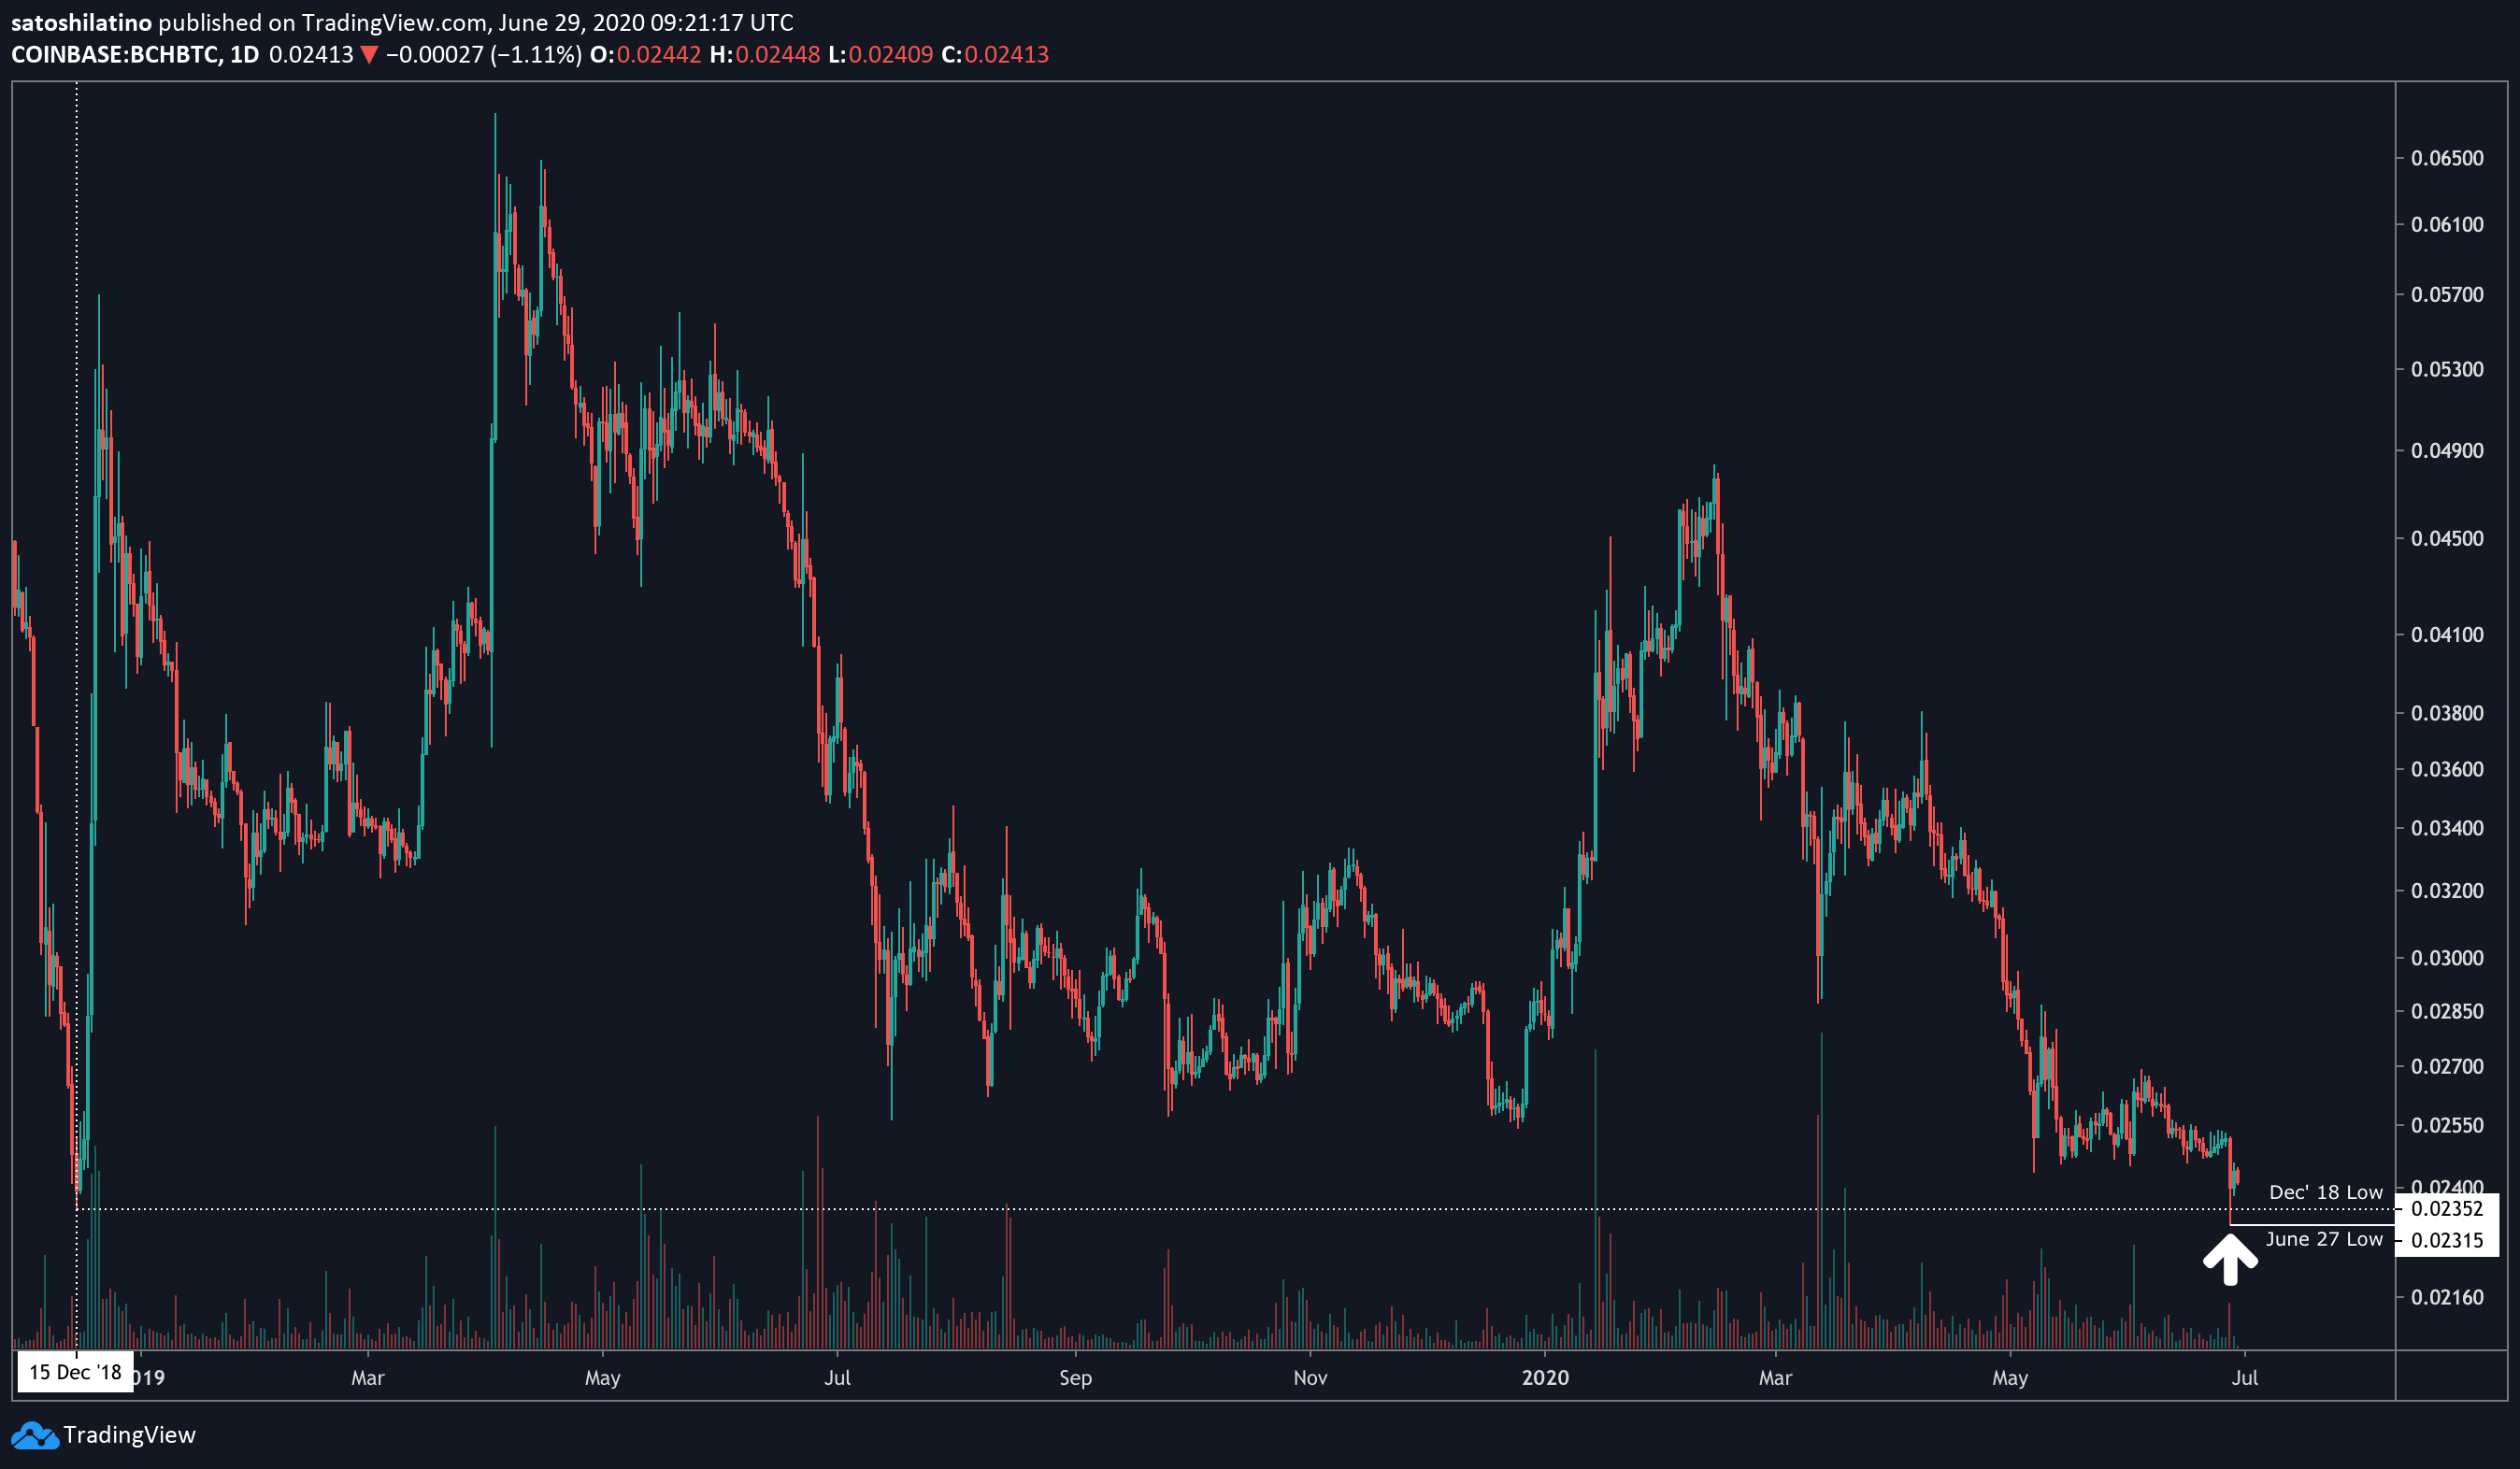
Nonetheless, this altcoin recently made a new all-time low against Bitcoin.
On June 27, Bitcoin Cash plunged to 2.31 million satoshis, which is the lowest it has been since it was created in 2017. The last time BCH hit such low prices against Bitcoin was back in mid-December 2018 when it dropped to a low of 2.35 million satoshis.
Despite Bitcoin Cash’s downward price action, a buy signal seems to be developing on its daily chart.
Everything’s Not Lost
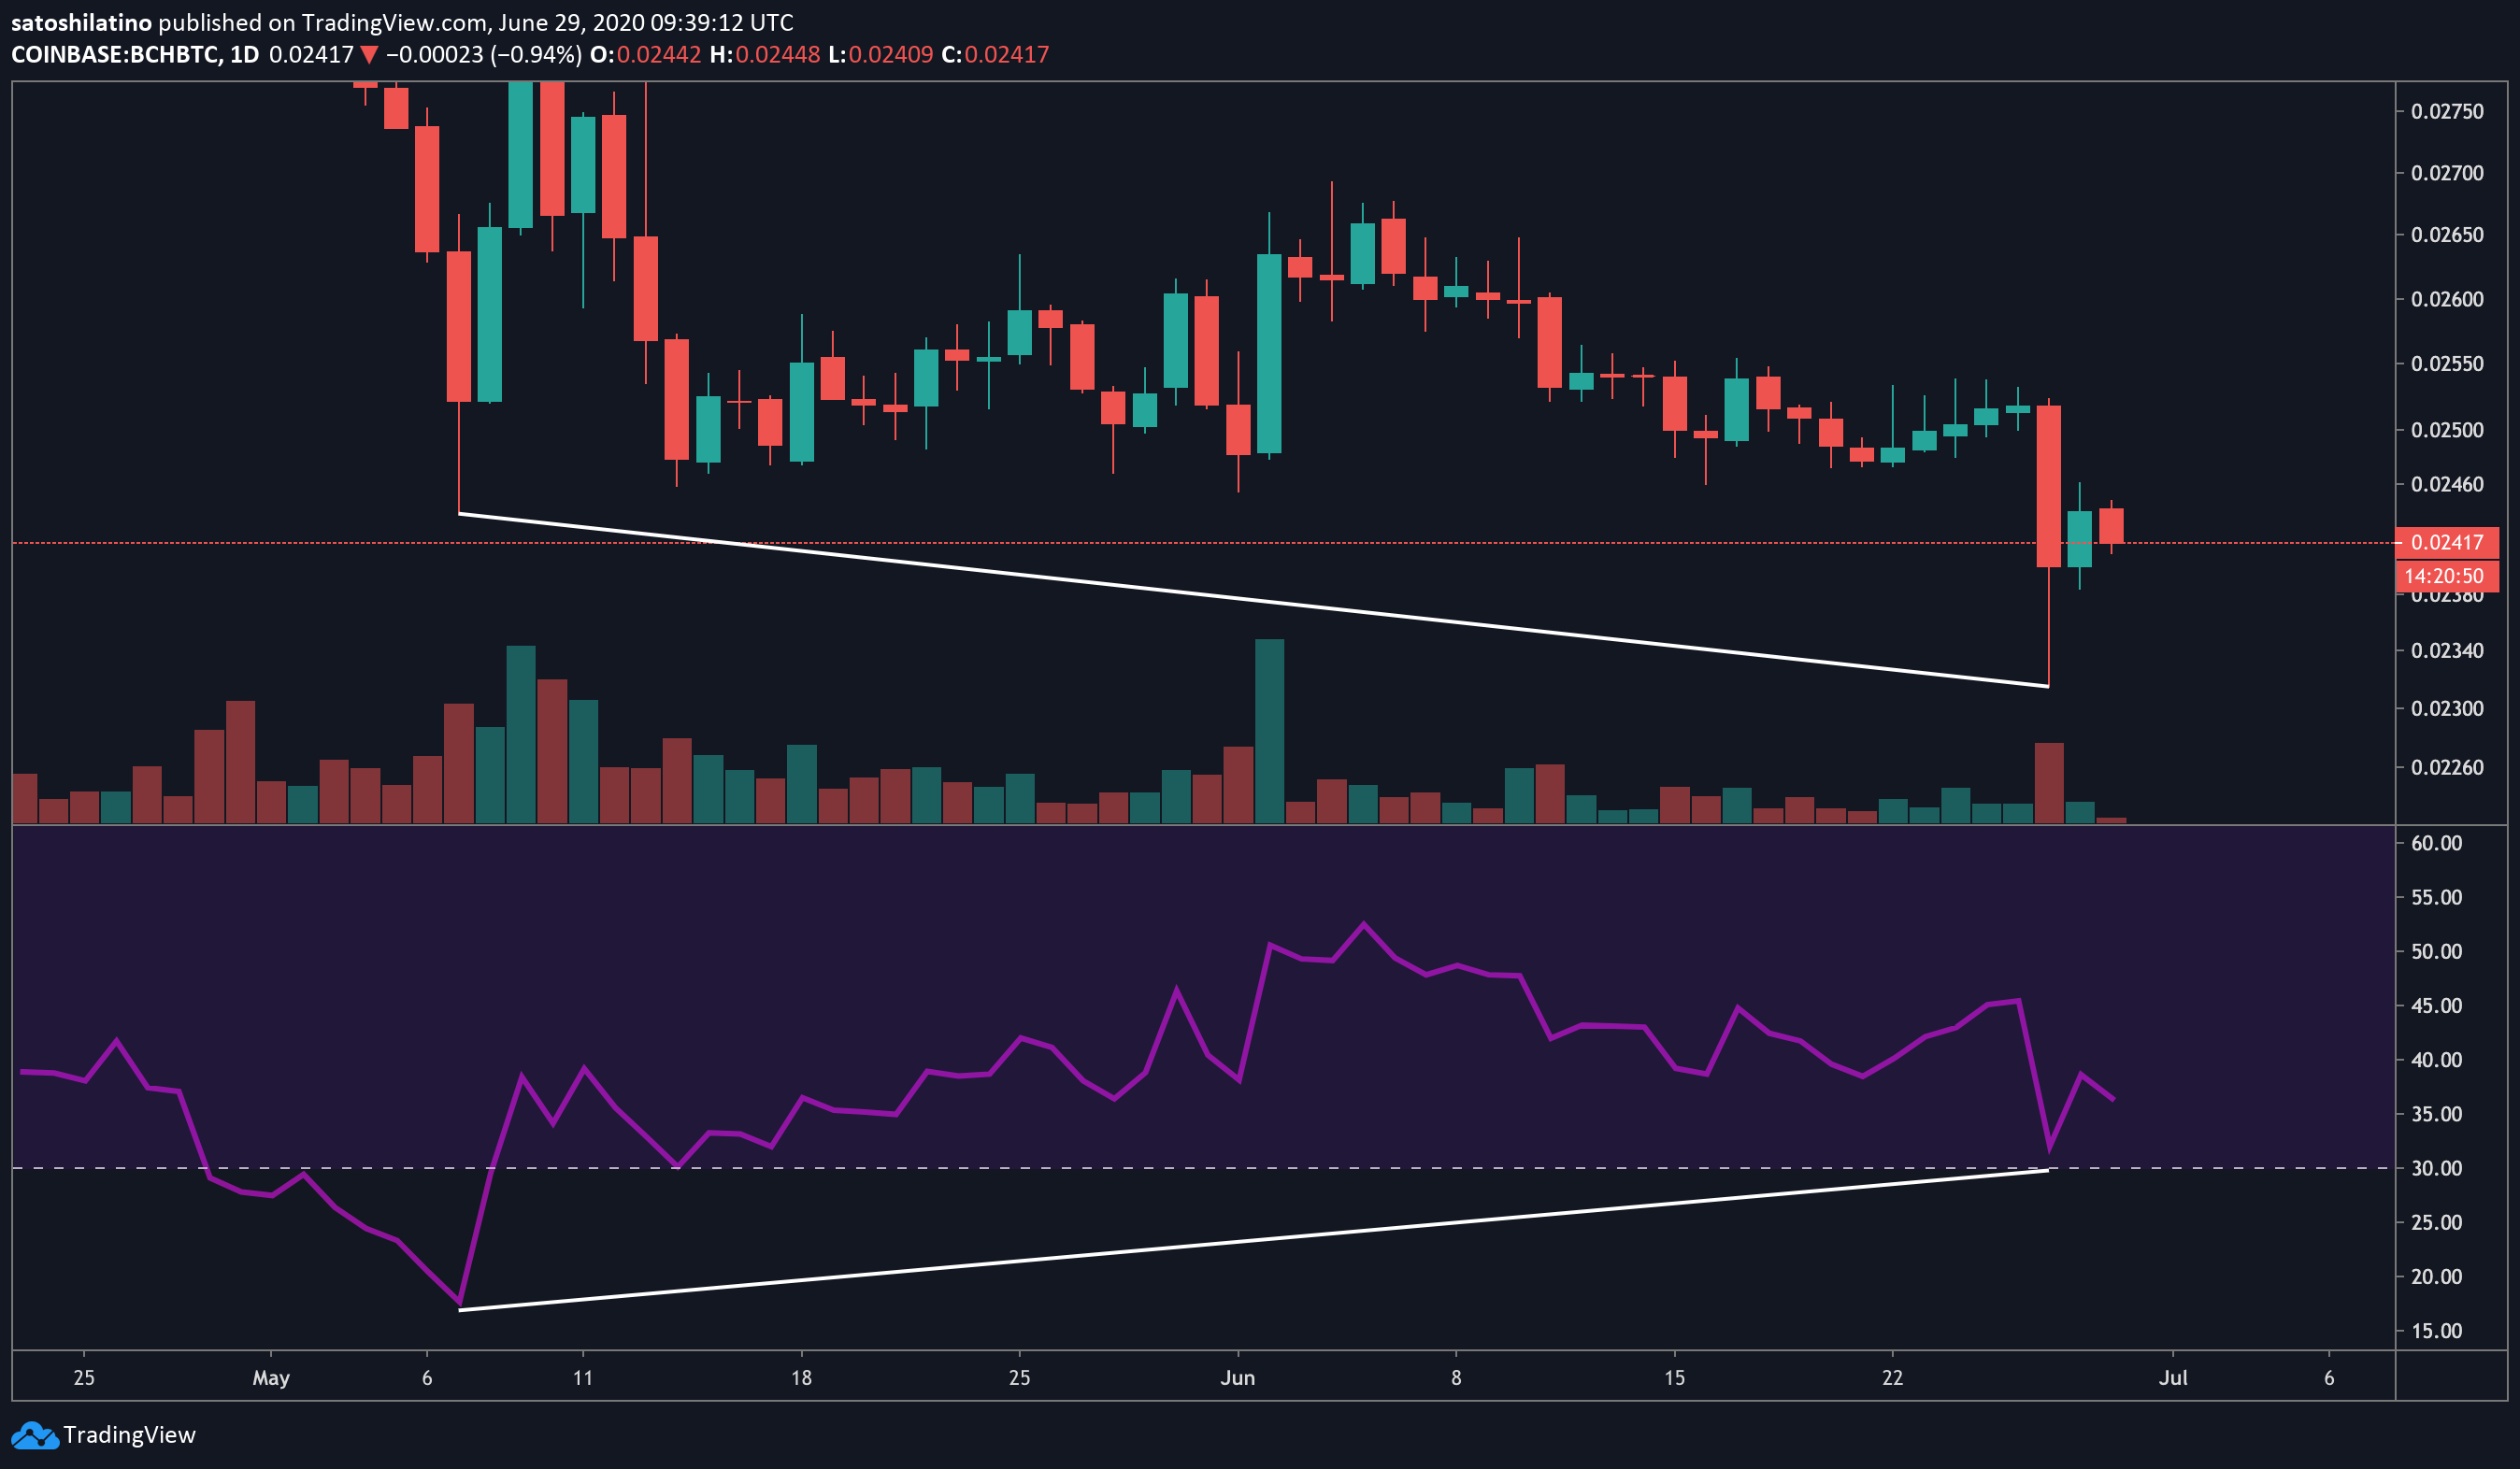
Within this time frame, a bullish divergence is forming between the relative strength index (RSI) and BCH’s price. Deviations usually occur when an oscillator, such as the RSI, disagrees with the actual price movement.
Since the RSI is currently making a series of higher lows while prices are declining, the overall trend of this cryptocurrency is improving over time. Thus, the odds for a trend reversal from bearish to bullish increase exponentially.
It is worth noting that this technical pattern does not provide a precise buying point. But it indicates that the downtrend is reaching oversold territory.
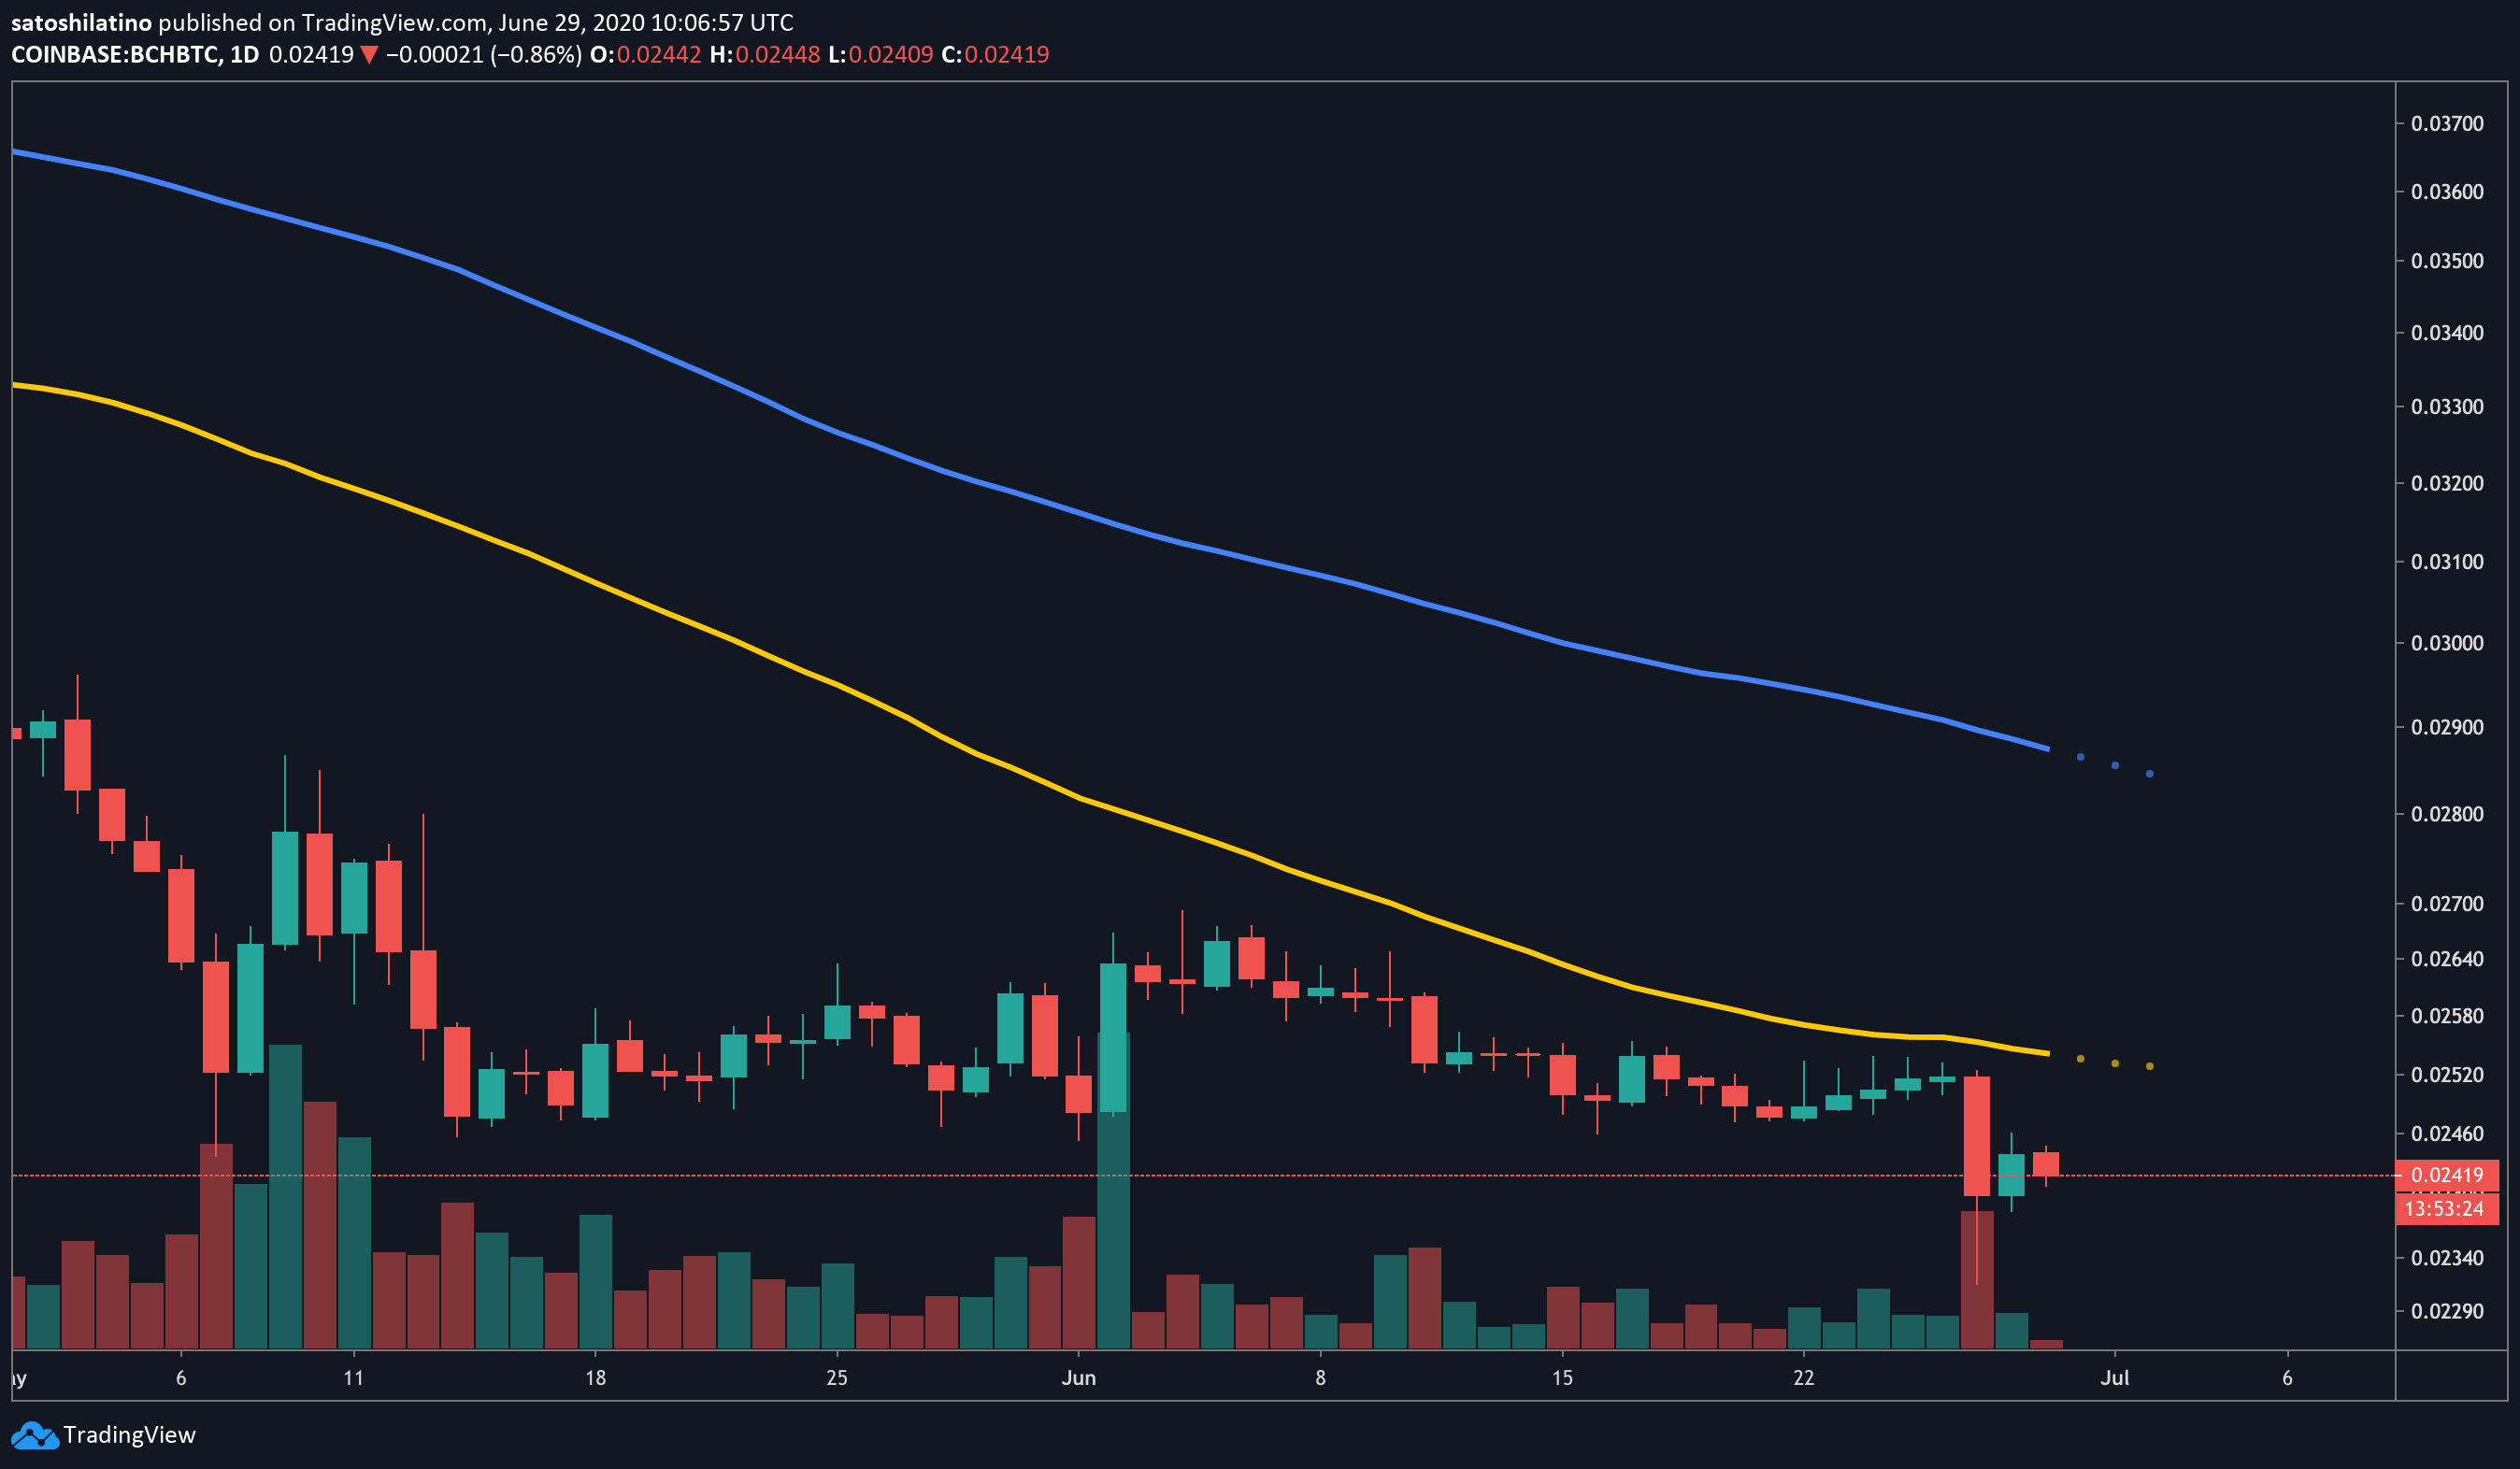
In the event of a bullish impulse, investors must watch out for the 50-day and 100-day moving averages since they can serve as profit-taking points.
These resistance levels hover around 2.54 and 2.87 million satoshis, respectively.
Nevertheless, a further increase in the selling pressure behind Bitcoin Cash may invalidate the bullish outlook.
If this were to happen, the Fibonacci retracement indicator estimates that BCH could drop to 1.63 million satoshis. This is where 127.2% Fibonacci retracement level sits when measured from mid-February’s high of 4.83 million satoshis to the recent swing low of 2.31 million satoshis.